ChartGPT
About ChartGPT
ChartGPT is a revolutionary tool that simplifies data visualization by converting text into stunning charts. Ideal for professionals, educators, and students, it streamlines the process of creating visual data representations, enhancing engagement and comprehension. Experience the ease of transforming textual data with ChartGPT today.
ChartGPT offers flexible pricing plans, ensuring accessibility for all users. The free tier allows basic chart creations, while premium plans unlock advanced features and additional credits. Upgrading provides greater capabilities, making it ideal for heavy users and professionals who require extensive data visualization options.
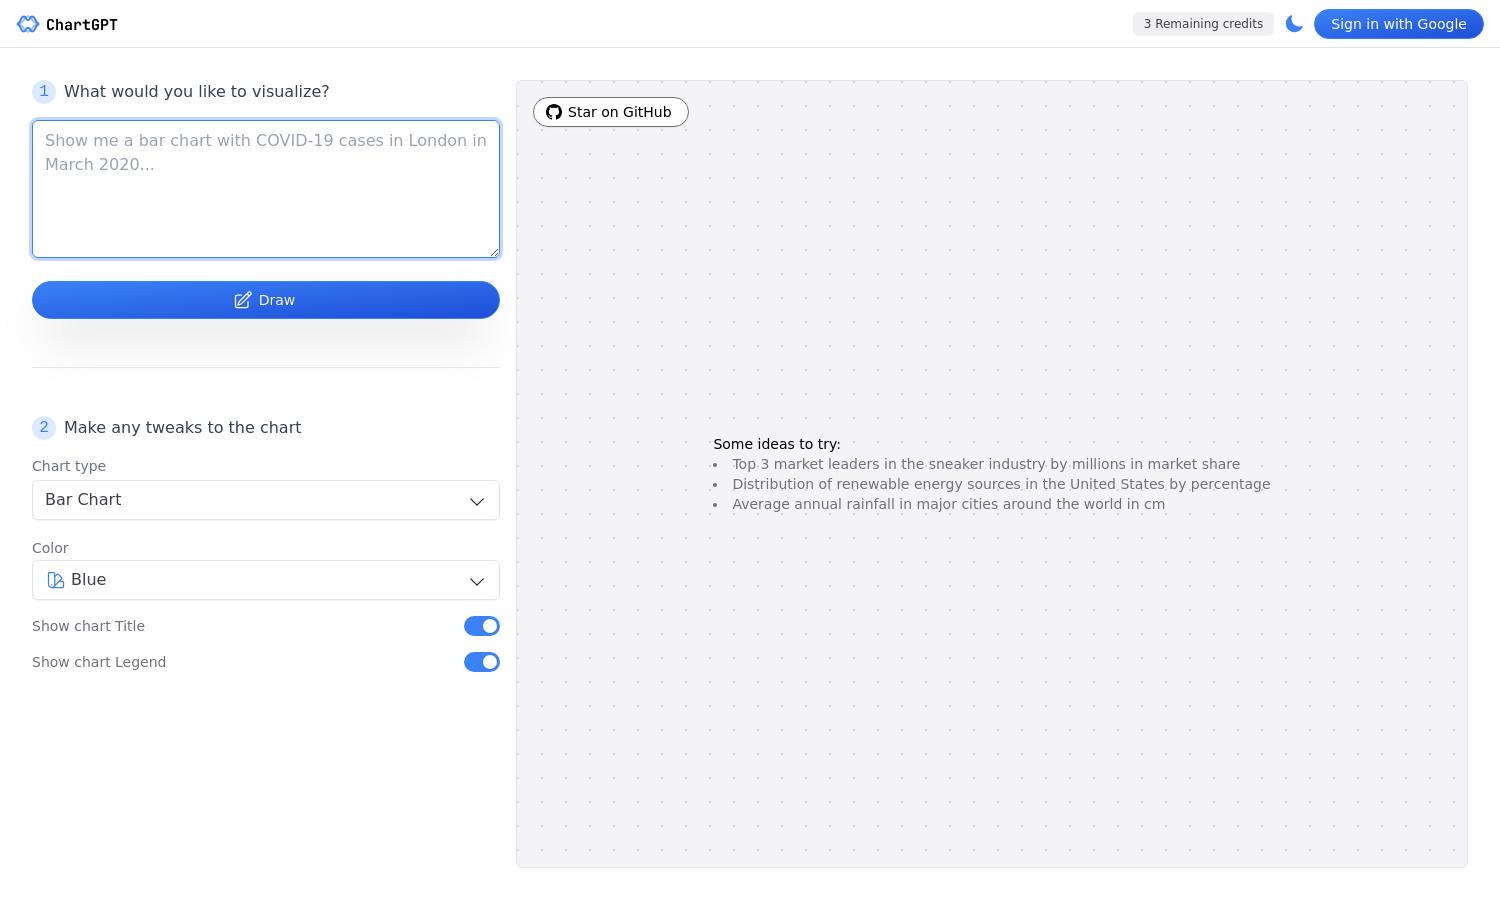
ChartGPT features an intuitive user interface designed for seamless navigation and interaction. Its clean layout and user-friendly design ensure clients can create charts effortlessly, making data visualization accessible to everyone. Experience the streamlined process of using ChartGPT as it elevates your data presentation needs.
How ChartGPT works
To use ChartGPT, users begin by signing in or creating an account on the website. After onboarding, they can input their textual data and select their preferred chart style. The platform quickly generates a visually appealing chart based on the input. Users can customize further, download, and share their charts effortlessly.
Key Features for ChartGPT
Text-to-Chart Conversion
ChartGPT’s standout feature is its ability to convert text into beautiful charts instantly. By utilizing advanced algorithms, ChartGPT simplifies the complex data visualization process, allowing users to focus on content rather than design. This feature saves time and enhances the clarity of data representation.
Customizable Chart Styles
Another key feature of ChartGPT is its variety of customizable chart styles. Users can choose from various designs to match their presentation needs or personal preferences. This flexibility allows individuals to create unique visuals that effectively communicate their message, further elevating data engagement and understanding.
User-Friendly Interface
ChartGPT’s user-friendly interface is designed for simplicity and efficiency. It allows users to navigate easily through the chart creation process, ensuring a smooth experience. This accessibility makes it perfect for both novices and experienced users, enabling everyone to visualize their data without hassle.
You may also like: