op

About op
op revolutionizes data analysis by combining spreadsheets, Jupyter notebooks, and AI-driven code generation. Tailored for analysts and data professionals, this user-friendly platform allows users to effortlessly interact with data by asking questions, generating relevant code, and simplifying their workflow for enhanced productivity and efficiency.
op offers a free trial with no credit card required, ensuring users can explore its features. Subscription plans include basic and premium tiers, each providing varying levels of access, functionality, and support. Upgrading enhances user experience, offering advanced features and exclusive tools tailored for efficient data analysis.
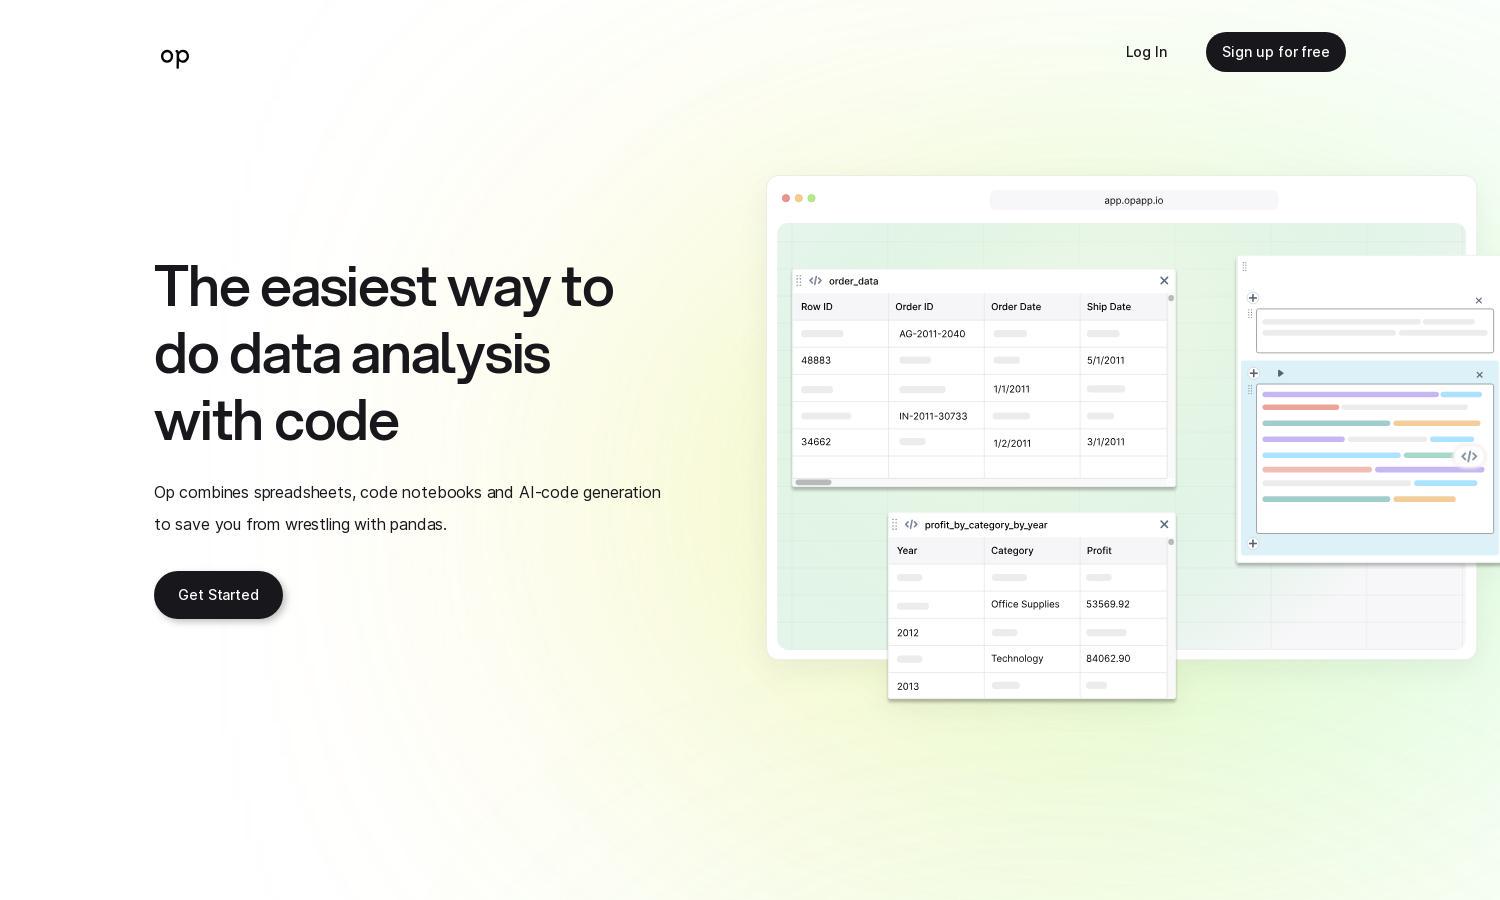
op features a sleek, intuitive interface designed for seamless navigation and user interaction. Its layout prioritizes user experience, offering easy access to key tools and resources. Unique features, such as integrated AI code generation and visual data synchronization, further enhance usability, making data analysis quick and efficient.
How op works
Users begin their journey with op by signing up for a free account, providing access to a range of data analysis tools. They can easily upload datasets or connect spreadsheets, then leverage the AI chat feature to ask specific questions about their data. op generates context-relevant code in response, simplifying complex data tasks, ensuring users see visual representations alongside code in Jupyter notebooks. This streamlined process emphasizes usability and efficiency, making data insights accessible for everyone.
Key Features for op
AI Code Generation
op's AI code generation feature sets it apart, allowing users to ask natural language questions about their data. The platform instantly generates relevant code, eliminating the need for extensive programming knowledge and enabling users to efficiently conduct analyses without wrestling with complex libraries like Pandas.
Seamless Data Synchronization
op ensures seamless data synchronization through its integration with spreadsheets and Jupyter notebooks. This key feature allows users to maintain visual tables in sync with code dataframes, providing a comprehensive overview of their analyses and facilitating quick, accurate insights without manual updates.
User-Friendly Interface
op boasts a user-friendly interface that enhances data analysis by streamlining navigation and accessibility. The platform's intuitive design supports easy interactions, allowing users to focus on insights rather than complex functionalities, making it ideal for both beginner and seasoned analysts in their data journeys.


