Easy Charts
About Easy Charts
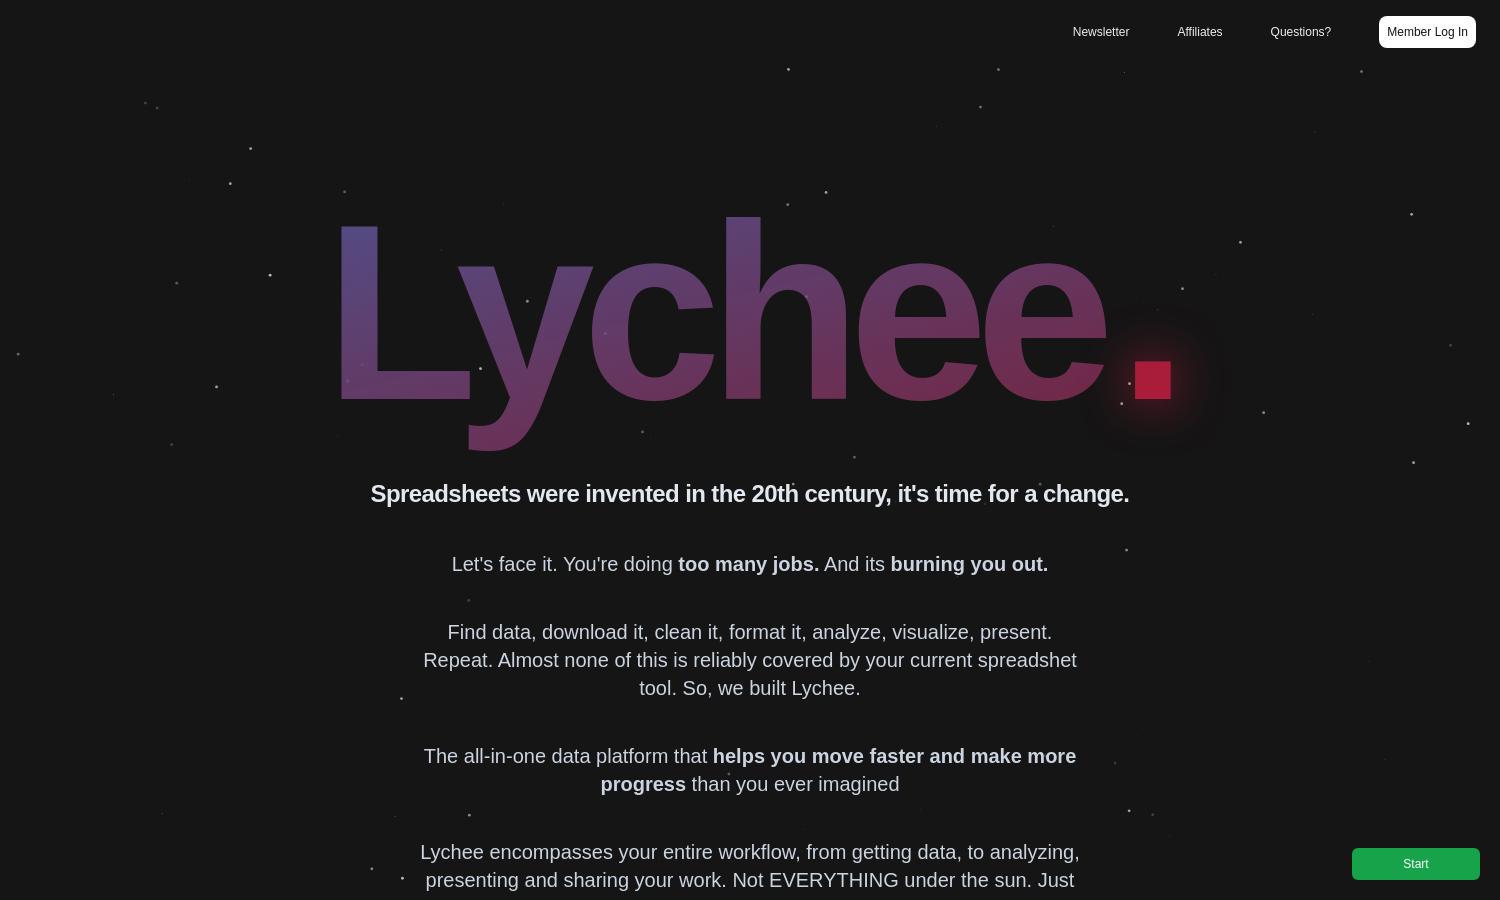
Lychee transforms data analysis by providing a comprehensive platform for professionals seeking efficient data management. Users can effortlessly pull and visualize data from multiple sources without coding. With a focus on user experience, Lychee solves complex data challenges, enabling faster decision-making and impactful presentations.
Lychee offers flexible pricing plans, including a free tier and a one-time payment lifetime access option. Users can enjoy immediate access to all features at just $39.99, which is significantly cheaper than traditional subscription models, with no hidden fees or ads, ensuring long-term value for users.
Lychee features an intuitive user interface designed for seamless navigation and accessibility. The layout enhances user experience, offering a streamlined design that allows users to quickly find features like data visualization, AI analysis, and presentation generation, making data handling effortless and enjoyable.
How Easy Charts works
Users start by onboarding effortlessly on Lychee, where they can connect their data sources with zero coding. Once connected, they utilize various tools for data cleaning, analysis, and visualization. The platform offers tutorials and AI assistance to guide users through creating presentations, sharing insights, and collaborating efficiently.
Key Features for Easy Charts
Instant Graph Generation
Lychee’s instant graph generation stands out as a dynamic feature that enables users to create visualizations instantly without any prior technical expertise. This ease of use allows professionals to focus on their data storytelling, ensuring impactful presentations and swift insights that propel decision-making forward.
AI-Powered Data Analysis
Lychee showcases AI-powered data analysis, allowing users to derive deep insights without manual effort. This innovative feature automates data interpretation and highlights key findings, streamlining the analytics process and empowering users to make informed decisions effectively, ultimately enhancing their productivity and efficiency.
No-Code Data Integration
One more defining feature of Lychee is its no-code data integration, which simplifies the process of connecting various data sources. Users can effortlessly pull data from platforms like Twitter, Google Sheets, and PDFs without any programming knowledge, making data entry and analysis accessible to everyone.
You may also like: