

About ChartToolBox
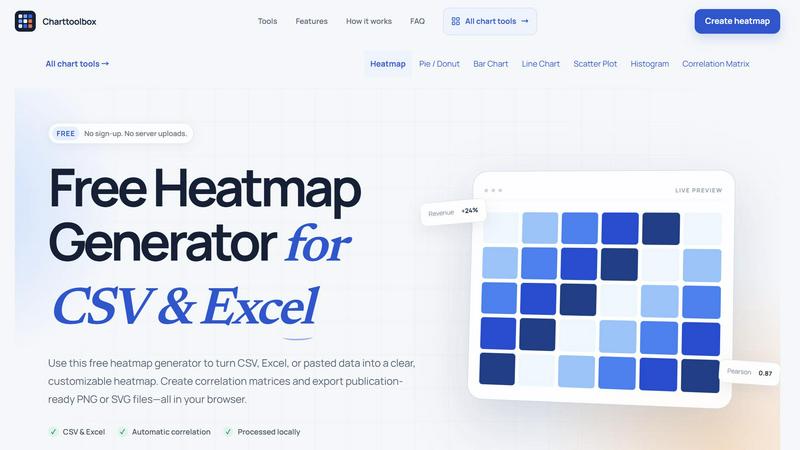
Charttoolbox turns spreadsheet data into charts without setting up a full BI dashboard. Upload a CSV, TSV, XLS, or XLSX file, paste a table, or start with sample data. Choose from heatmaps, pie/donut charts, bar charts, line charts, scatter plots, histograms, and correlation matrices. Adjust the fields and presentation, then export a PNG or SVG. Your spreadsheet contents are processed locally in your browser. The tools are free to use and require no account.
Similar to ChartToolBox

DeskBot
DeskBot for Kalshi event contracts. $1 first month, then $19.99/mo. Trading can lose money. Not affiliated with Kalshi.

TallyNexa
TallyPrime books live on any phone, a WhatsApp summary every morning and Nexa AI answers from your books.

MarketPing
Stock market alerts on WhatsApp, read by AI. Every NSE & BSE filing summarised as it is filed, with the measured price reaction.


Engineering on Web
Free browser CAD, FEA and SPC with an AI assistant: model by text or voice, AI-tuned solvers, AI result interpretation. No install, no account.

MiroFish (mirofish.work)
Explore possible reactions to a scenario using AI agents, source-based knowledge graphs, and simulation reports.

AI Search Analyzer
See what ChatGPT, Gemini, Claude, Perplexity and Google's AI Overviews say about your business, and get the fixes for your site.