

GeoRank
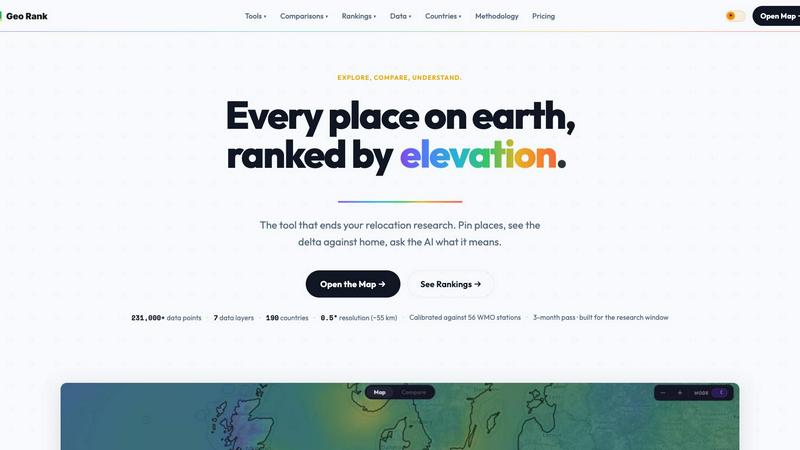
GeoRank is an interactive global map that lets you compare sunshine, taxes, and cost of living across 190 countries to simplify relocation research.
About GeoRank
GeoRank is a powerful, data-driven mapping tool designed to end the endless cycle of relocation research. It helps you explore, compare, and decide where to live by providing calibrated, ground-truthed data on over nine key metrics across nearly every place on earth. Whether you are a digital nomad searching for your next home base, a remote worker evaluating cost of living and community sentiment, or an investor assessing tax rates and geopolitical stability, GeoRank transforms complex, often conflicting information into clear, actionable insights. The platform offers interactive map layers for sunshine hours, temperature, rainfall, outdoor hours, tax rates, visas and residency, cost of living, geopolitical risk, and a unique community sentiment signal called Nomad Pulse. What sets GeoRank apart is its commitment to accuracy: raw satellite data is bias-corrected against 182 ground reference stations from organizations like the WMO and KNMI, ensuring that a sunny forecast in a cloudy region is not an overestimate. You can pin up to 20 locations, compare them directly against your current home base to see deltas (e.g., "20% cheaper, 10% more sunshine"), and even ask a built-in AI to reason across your entire shortlist. It is a comprehensive, user-friendly tool that turns data into decisions, and it is free to start exploring the map without any account.
Features of GeoRank
9 Interactive Map Layers
GeoRank provides nine live, togglable data layers that you can stack and explore simultaneously. These layers cover Sunshine (calibrated against 182 stations), Temperature, Rainfall, Outdoor Hours, Tax, Visas and Residency, Cost of Living, Geopolitical Risk, and Nomad Pulse. Each layer is powered by a specific data source, such as the SARAH-3 satellite for sunshine or community social posts for sentiment. You can pan globally and zoom down to a 0.05 degree resolution (about 5.5 km) to see hyper-local data. Clicking any layer reveals its source, coverage, and accuracy, giving you full transparency into the numbers you are seeing.
Pin and Compare Mode
This feature allows you to pin up to 20 different locations from anywhere on the map, with your pins saved across sessions for ongoing research. Once pinned, you can switch to Compare Mode and set your current home base as a baseline. The interface then shows every metric as a delta relative to your home, making it instantly clear how a new location stacks up. For example, you can see exactly how many more sunshine hours a city offers, how much cheaper the cost of living is, or how the geopolitical risk compares to where you are now. This relative comparison is far more practical than looking at absolute numbers alone.
Calibrated Sunshine Data
GeoRank solves a common problem with satellite-based weather data: overestimation of sunshine in cloudy regions. Raw reanalysis data like ERA5 can overestimate sunshine by 16 to 73 percent in such areas. GeoRank corrects this by merging SARAH-3 satellite observations with ERA5 data and then applying a bias correction using Inverse Distance Weighting (IDW) interpolation against 182 ground reference stations from Reykjavik to Phoenix to Sydney. The result is highly accurate sunshine data, typically within plus or minus 8 percent for most locations, with terrain corrections for high-altitude and coastal areas.
AI Chat on Your Shortlist
Once you have pinned your locations, you can use the integrated AI chat to ask complex, comparative questions. Unlike generic AI tools, this chat operates exclusively on your specific pinned data. You can ask questions like "Which of my five places has the best winter?" or "Score my shortlist for sunshine, cost, and low tax combined." The AI understands all metrics for every pinned place and can reason across them in a single response, providing trade-offs and clear recommendations based on your stated criteria. It saves you from manually cross-referencing tables and spreadsheets.
Use Cases of GeoRank
Relocation Research
GeoRank is the ultimate tool for anyone considering a move to a new city or country. Instead of visiting dozens of websites for weather, tax, and cost of living data, you can explore everything on one interactive map. Pin up to 20 potential destinations, set your current home as a baseline, and instantly see the deltas for sunshine, temperature, taxes, and safety. This side-by-side comparison makes it easy to narrow down your options and identify the place that best fits your lifestyle and budget, turning a months-long research process into a few hours of focused exploration.
Remote Work Planning
For digital nomads and remote workers, choosing a location involves balancing cost of living, community, and climate. GeoRank helps you assess all three at once. You can use the Cost of Living layer to find affordable cities, the Nomad Pulse layer to see where other nomads are reporting positive sentiment, and the Sunshine or Temperature layers to ensure a pleasant work environment. The ability to compare these factors against your current location helps you understand the real trade-offs before you book a flight or rent an apartment.
Investment Decisions
Investors looking to buy property or start a business abroad need reliable data on tax rates and geopolitical stability. GeoRank provides both in a single, comparable view. You can evaluate corporate or personal income tax rates across different countries using the Tax layer, while simultaneously assessing the Geopolitical Risk layer to understand stability and safety. By pinning multiple investment targets and comparing them side-by-side, you can make a more informed decision about where your capital is safest and most tax-efficient.
Visa and Passport Strategy
Understanding where your passport allows you to stay and for how long is a critical part of any international move. GeoRank includes a dedicated Visas and Residency layer that integrates with your passport information. You can check visa-free durations, visa-on-arrival options, and residency pathways for up to 10 different passports across 47 destinations. This feature is invaluable for digital nomads and expats who need to plan their travel and legal status, ensuring they do not overstay their welcome or miss out on a favorable visa regime.
Frequently Asked Questions
Do I need to create an account to use GeoRank?
No, you do not need an account for basic map exploration. You can start using the interactive map and toggling the various data layers immediately for free. Creating an account is only required if you want to save your pinned locations across sessions or use the advanced AI chat feature on your shortlist.
How accurate is the sunshine data?
GeoRank's sunshine data is highly accurate for most locations, typically within plus or minus 8 percent. This accuracy is achieved by calibrating raw satellite data (SARAH-3 and ERA5) against 182 ground reference stations from the WMO and KNMI. The correction process uses IDW interpolation to fix the common problem of satellite overestimates in cloudy regions, which can otherwise be off by 16 to 73 percent. High-altitude locations and coastal microclimates may have a slightly wider margin of error, around plus or minus 15 to 20 percent.
What is the Nomad Pulse layer?
The Nomad Pulse layer is a unique feature that tracks weekly sentiment from the digital nomad community. It processes social media posts to generate a signal for each country and city, indicating whether community enthusiasm is rising, stable, or falling. This gives you a real-time, grassroots perspective on where people are excited to be, which can be a leading indicator of a location's popularity and livability for remote workers.
Can I compare my pinned locations against each other?
Yes, absolutely. GeoRank's Compare Mode is designed for exactly this purpose. After you have pinned up to 20 locations, you can switch to Compare Mode and set any one of them as your home base. The tool will then display every metric for all your other pinned locations as a delta (difference) against that home base. This makes it incredibly easy to see which place is warmer, cheaper, safer, or has more sunshine relative to your chosen reference point.
Explore more in this category:
Best Analytics & Data AI tools
Best Lifestyle & Entertainment AI tools
Similar to GeoRank

SendNow
SendNow helps teams securely share sensitive files, track engagement, and manage branded deal rooms. Control downloads, expiration, and viewer access.


Stock Expert AI
Free US-stock research: company pages, screeners and dated AI analysis, with every figure from a named data provider.

Matcha Remover
Remove the green matcha cast from photos and videos in your browser — adjust the tint, compare before and after, and export privately.

Online Keyboard Synth
Free browser-based keyboard synthesizer — play instantly with keyboard, mouse, touchscreen or MIDI,

Text to Cursive
Free online cursive font generator — 10 cursive fonts, 19 copy-ready Unicode styles, PNG export, plus a signature maker and worksheet generator.

RealtyPhoto AI
Enhance and virtually stage property photos with AI for real estate listings.
