Banknaked vs Dividend Data
Side-by-side comparison to help you choose the right AI tool.

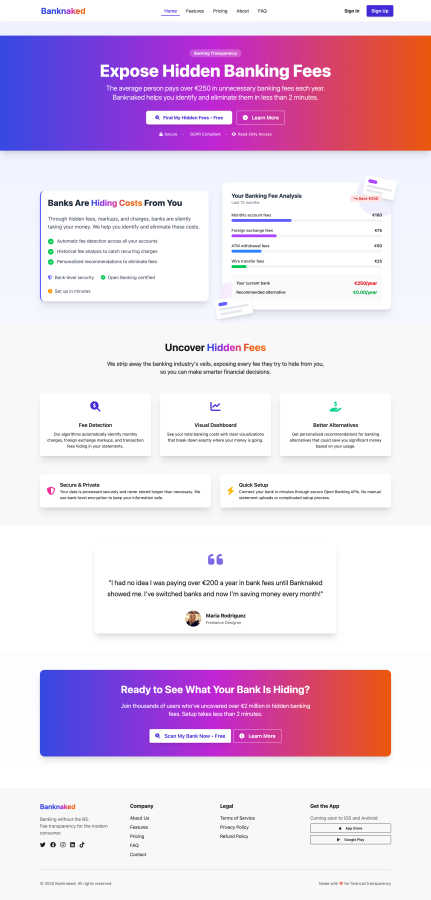
Banknaked uncovers hidden bank fees in minutes, helping you save money and make smarter financial choices.
Last updated: March 1, 2026
Dividend Data
Instantly pull stock dividends, prices, and financials directly into your Google Sheets or Excel spreadsheets.
Last updated: March 11, 2026
Visual Comparison
Banknaked
Dividend Data

Feature Comparison
Banknaked
Automatic Fee Detection
Banknaked employs advanced algorithms to automatically identify various fees associated with your banking activities. It scans your bank statements for monthly maintenance fees, foreign exchange markups, and transaction charges that may be hidden from your view, ensuring you never miss a cost.
Visual Dashboard
The platform features a user-friendly visual dashboard that displays your total banking costs. With clear graphs and breakdowns, you can easily see where your money is going, making it simple to track and understand your financial habits.
Historical Fee Analysis
With Banknaked, you can perform a historical analysis of your fees over the past year. This feature helps you catch recurring charges that may have slipped through the cracks, allowing you to make informed decisions about your banking.
Personalized Recommendations
Based on your spending habits, Banknaked offers personalized suggestions for banking alternatives that can significantly reduce your fees. This proactive approach not only highlights the problems but also provides practical solutions to enhance your financial health.
Dividend Data
Extensive Spreadsheet Functions
Dividend Data provides 16 custom, easy-to-use functions that cover every essential data point for fundamental analysis. Simply type formulas like =DIVIDENDDATA_DIVIDENDS("TICKER") or =DIVIDENDDATA_RATIOS("TICKER", "PeRatio") and the live data instantly populates your cell. These functions pull from a vast database, giving you one-click access to forward dividends, ex-dates, financial metrics, and real-time quotes, transforming your spreadsheet into a dynamic research terminal.
Decades of Historical Data
Access over 30 years of clean, reliable historical market data for a comprehensive long-term view. This deep historical context is crucial for analyzing dividend growth trends, assessing company performance through multiple economic cycles, and building robust financial models. Whether you're backtesting a strategy or calculating a 10-year dividend growth rate, you have the historical depth needed for thorough due diligence.
Cross-Platform Compatibility
The tool works seamlessly in both Google Sheets and Microsoft Excel environments. You can download it as an add-in from the Microsoft AppSource or install it as a Google Workspace add-on. This flexibility ensures teams and individual investors can use their preferred spreadsheet software without sacrificing functionality, making collaboration and data consistency easy across different platforms.
Built for Fundamental & Dividend Investors
Every feature is crafted with the needs of income and value investors in mind. The data focuses on dividend sustainability (payout ratios, growth rates), fundamental health (financial statements, earnings), and key valuation metrics. It cuts through the noise to deliver the specific data points—like next ex-dividend date or forward yield—that are most critical for building and managing a dividend-focused portfolio.
Use Cases
Banknaked
Identify Hidden Fees
Imagine you are reviewing your monthly bank statements and feel puzzled by various charges. With Banknaked, you can swiftly identify hidden fees, giving you the clarity you need to understand what you are actually paying for and how you can save.
Compare Banking Options
If you are contemplating switching banks, Banknaked allows you to compare your current banking fees with potential alternatives. This feature empowers you to make informed decisions and select the best bank for your needs without the fear of hidden costs.
Negotiate Better Deals
Banknaked equips you with the knowledge to negotiate better deals with your bank. By having a clear understanding of your fees, you can approach your bank with confidence and request lower charges or better terms.
Improve Financial Awareness
Using Banknaked promotes overall financial awareness. By regularly checking your banking fees and understanding where your money goes, you can develop healthier spending habits and work towards achieving your financial goals.
Dividend Data
Automated Dividend Portfolio Tracking
Manually updating a portfolio spreadsheet with current yields, dividend dates, and payment amounts is a chore. With Dividend Data, you can create a master watchlist or portfolio tracker where all these figures update automatically. Set formulas once for tickers like MSFT or KO, and your sheet will always display the latest forward dividend, yield, and next ex-date, saving hours of maintenance each month.
Screening and Comparative Analysis
Quickly screen and compare potential investments directly in your spreadsheet. Use the functions to pull key ratios like P/E, P/B, or debt-to-equity for a list of stocks side-by-side. Analyze dividend growth rates or payout ratios across sectors to identify the most financially stable and shareholder-friendly companies, all without ever leaving your familiar analytical environment.
Building Dynamic Financial Models
Create powerful, auto-updating discounted cash flow (DCF) models or dividend discount models (DDM). Link your model assumptions directly to live data feeds for revenue, EPS, and dividend per share. This ensures your valuation models are always based on the most recent reported figures, making your investment thesis and price targets more accurate and timely.
Educational Research and Backtesting
Ideal for students, bloggers, and investors honing their skills. Easily pull 10 years of dividend history to chart a company's growth trajectory or analyze how a stock's valuation multiples have changed over time. Test historical investment rules or strategies by building sheets that leverage decades of price and fundamental data for robust, evidence-based learning.
Overview
About Banknaked
Banknaked is your personal financial detective, designed to uncover the hidden costs of your banking. In an era where banks often obscure fees within convoluted statements, Banknaked simplifies the process, providing a clear and understandable breakdown of every charge incurred. By securely connecting to your bank account through Open Banking technology, Banknaked reveals the exact fees you are paying, including monthly maintenance charges, foreign exchange markups, ATM withdrawal fees, and those elusive "miscellaneous" costs. This tool is perfect for anyone who wants to take control of their finances, whether you are looking to switch banks, negotiate a better deal, or simply understand the flow of your money. With a privacy-first commitment, Banknaked offers read-only access, ensuring your funds remain untouched. Additionally, users can delete their data at any time. In mere minutes, Banknaked delivers a comprehensive fee analysis, plain language explanations, and annual projections of your banking costs. Most importantly, it doesn't just highlight the issues but provides tailored recommendations for cheaper banking alternatives based on your actual spending habits, helping you save money where it counts.
About Dividend Data
Dividend Data is a powerful financial data platform designed to bring institutional-grade stock market information directly into the tools you already use every day: Google Sheets and Microsoft Excel. It eliminates the tedious, error-prone process of manually copying and pasting data from financial websites. Instead, you get instant, live access to over 30 years of historical data for more than 80,000 tickers through simple, custom spreadsheet formulas. Built specifically by and for dividend and fundamental investors, it provides a comprehensive suite of data points including dividend amounts, yields, payout ratios, growth rates, complete financial statements, key valuation ratios, and real-time price history. The core value proposition is powerful simplicity: you get the deep data needed for serious investment analysis without needing API keys, coding skills, or a massive budget. With a generous free tier offering 2,500 monthly credits that never expire, it's built to empower every investor to make more informed, data-driven decisions right from their spreadsheet.
Frequently Asked Questions
Banknaked FAQ
How does Banknaked connect to my bank?
Banknaked connects to your bank account securely using Open Banking technology. This means it has read-only access, ensuring that your funds remain safe and untouched while providing you with detailed fee insights.
Is my data safe with Banknaked?
Absolutely! Banknaked prioritizes your privacy and data security. It uses bank-level encryption and complies with GDPR regulations, ensuring that your information is processed securely and stored only for as long as necessary.
Can I cancel my subscription at any time?
Yes, you can choose to delete your data and cancel the service at any time. Banknaked is designed to be user-friendly and respects your choices regarding your financial information.
What kind of fees can Banknaked detect?
Banknaked can detect a variety of banking fees, including monthly maintenance fees, foreign exchange markups, ATM withdrawal charges, wire transfer fees, and any other hidden costs that may be lurking in your bank statements.
Dividend Data FAQ
How does the free tier work?
The free tier is remarkably generous and designed to be permanently useful. You receive 2,500 credits every month, which do not expire and refresh on a monthly cycle. Each data pull using a formula typically costs 1 credit. This allows for substantial usage, such as updating a portfolio of 50 stocks with several data points each month, completely free of charge and without any trial period pressure.
Do I need to know how to code or use APIs?
Absolutely not. Dividend Data requires zero coding knowledge or API integration. The entire system works through simple spreadsheet formulas that anyone familiar with basic Excel or Google Sheets functions can use. You just type the formula with the stock ticker, and the data appears instantly—no technical setup, key management, or complex configuration is needed.
What kind of data can I access?
You have access to a comprehensive suite of data critical for fundamental analysis. This includes dividend data (amounts, yields, dates, growth), real-time quotes and price history, complete financial statements (income, balance sheet, cash flow), and over 100 key financial ratios (valuation, profitability, liquidity). The database covers 80,000+ global tickers with 30+ years of history.
Is my data secure and private?
Yes. Dividend Data operates with a strong commitment to privacy. Your spreadsheet data and portfolio information are not stored on their servers. The add-in/plug-in facilitates a direct data pull into your sheet. You are in complete control of your data within your own spreadsheet file, which resides in your Google Drive or on your local computer.
Alternatives
Banknaked Alternatives
Banknaked is a personal finance tool that specializes in uncovering hidden bank fees, transforming complex financial statements into clear insights. It belongs to the analytics and data category, focusing on providing users with a comprehensive breakdown of their banking costs. Users often seek alternatives due to varying needs such as pricing, feature sets, and specific platform functionalities that align more closely with their financial habits. When evaluating alternatives, consider factors such as ease of use, security measures, the comprehensiveness of fee detection, and the quality of personalized recommendations. It's essential to find a solution that not only identifies your banking costs but also offers actionable insights to help you save money effectively.
Dividend Data Alternatives
Dividend Data is a specialized tool that brings over 30 years of stock market data directly into your spreadsheets. It falls into the category of financial data providers, specifically designed for investors who focus on dividends and company fundamentals. Users often explore other options to find the best fit for their specific needs. People look for alternatives for various reasons. This could be due to budget constraints, a need for different features not offered, or because they primarily use a platform that isn't supported. Some may require more advanced analytical tools or a different data delivery method. When evaluating other services, consider what's most important for your workflow. Key factors include the depth and accuracy of historical data, the cost relative to your usage, compatibility with your preferred spreadsheet software, and how easily you can access the specific metrics you need without a technical hassle.