ChartFromText vs Preuve AI
Side-by-side comparison to help you choose the right AI tool.
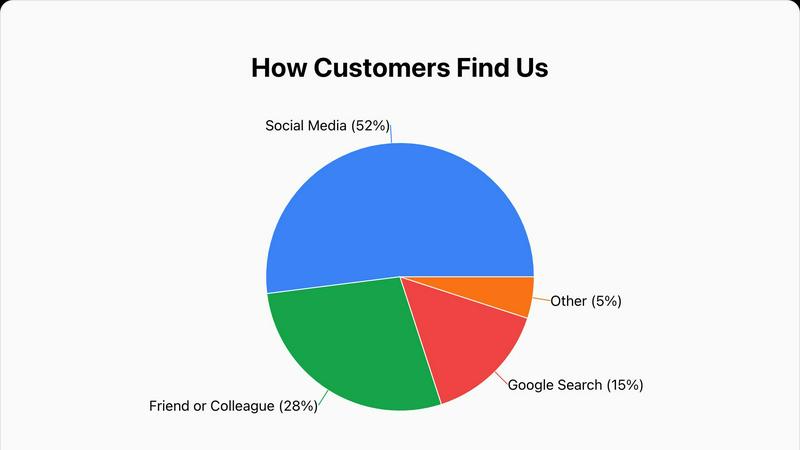
Instantly create beautiful pie charts from your text data in seconds with our free online generator.
Last updated: February 28, 2026
Preuve AI validates your startup ideas with real-time data, uncovering competitors and blind spots to boost your success.
Last updated: April 4, 2026
Visual Comparison
ChartFromText
Preuve AI
Feature Comparison
ChartFromText
Instant Text-to-Chart Conversion
The hallmark feature of ChartFromText is its ability to generate a chart directly from pasted text. You don't need to manually plot points or build complex tables. Simply copy data in a simple 'Label, Value' format from any source and paste it into the input field. The tool's smart parser understands the format instantly, converting your raw text into a structured visual chart within seconds, saving you immense time and effort.
Comprehensive Customization Options
While the process is simple, you still have full control over your chart's appearance. You can add a custom title, choose a background color to match your brand or presentation theme, and select how data labels are displayed. Options include showing values inside the chart slices, using connecting lines for clarity, or opting for a clean, separate legend. This flexibility ensures your final chart looks exactly how you envision it.
High-Resolution PNG Downloads
Every chart you create with ChartFromText can be downloaded as a high-resolution PNG image file. This ensures your visuals remain crisp, clear, and professional-looking whether they are embedded in a digital presentation, printed in a report, or shared online. You get a polished, ready-to-use graphic without any watermarks or quality loss.
Free & No-Account Required Access
ChartFromText is committed to being truly accessible. It is completely free to use with no hidden fees, subscription tiers, or premium feature locks. Most importantly, you can start creating and downloading charts immediately without having to sign up for an account or provide any personal information. This respects your privacy and gets you to your finished chart faster.
Preuve AI
Comprehensive Viability Reports
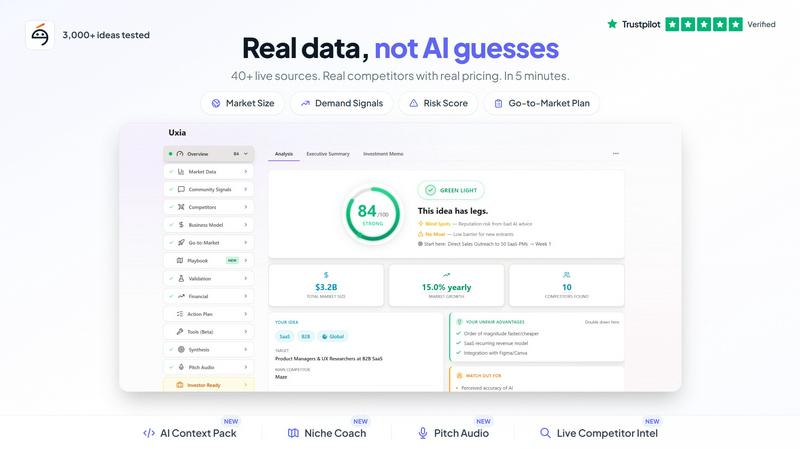
Preuve AI generates detailed viability reports for submitted ideas, encompassing competitor analysis, market size, and demand signals. Each report is backed by data from over 40 live sources, ensuring that entrepreneurs receive accurate and actionable insights tailored to their specific ideas.
Competitive Mapping
With the ability to map up to 15 competitors, Preuve AI provides users with critical insights into the competitive landscape. This feature includes funding data and pricing benchmarks, enabling founders to understand their competition thoroughly and make informed decisions about their market entry strategy.
Quick Free Scans
In just 60 seconds, users can access a free scan that offers a high-level overview of their startup idea. This quick assessment includes a viability score, a brief competitor preview, and highlights potential blockers and leverage points, allowing entrepreneurs to understand if further investigation is warranted.
Pivot Recommendations
Preuve AI doesn’t just stop at validation; it also offers actionable pivot recommendations. By analyzing the submitted idea and its market context, the tool provides insights on how founders can adjust their approach to improve viability and better meet market demands.
Use Cases
ChartFromText
Student Assignments and Projects
Students can effortlessly elevate their essays, science fair projects, or research papers by adding professional-looking charts. Instead of describing data in paragraphs, they can paste survey results, experimental data, or historical figures from their notes directly into ChartFromText to create clear, impactful visuals that demonstrate understanding and improve their grades.
Business and Financial Presentations
Professionals can quickly generate charts for meetings, reports, or client proposals. Whether it's visualizing a project's budget allocation, showing quarterly sales breakdowns, or illustrating market share, ChartFromText turns spreadsheet data into compelling pie or bar charts in moments, making complex financial information easy for any audience to digest.
Educational Teaching Materials
Teachers and professors can use ChartFromText to create engaging visual aids for their lessons. By transforming statistical data, historical trends, or scientific proportions into charts, educators can explain concepts more clearly, capture students' attention, and provide visual handouts that enhance learning and retention in the classroom.
Content Creation for Blogs and Social Media
Bloggers, marketers, and social media managers can use ChartFromText to create eye-catching graphics for their content. Visualizing poll results, survey data, or simple statistics in a colorful pie or bar chart is a proven way to increase reader engagement, make articles more shareable, and present information in a snackable, visually appealing format.
Preuve AI
Startup Founders Validating Ideas
Entrepreneurs looking to enter the market can use Preuve AI to validate their business ideas quickly. By receiving a viability score and comprehensive report, founders can determine whether to proceed with development or pivot their concepts based on solid data.
Investors Evaluating Opportunities
Investors can leverage Preuve AI to analyze potential startups before committing funds. The detailed reports provide insights into market demand and competitive landscapes, helping investors make informed decisions about where to allocate their resources.
Teams Qualifying Leads
Sales and marketing teams can utilize Preuve AI to assess startup leads before initial meetings. By understanding the viability and competitive positioning of potential clients, teams can tailor their pitches and strategies for maximum impact.
Market Researchers Seeking Insights
Market researchers can use Preuve AI to gather comprehensive data on emerging trends and competitor activity within various industries. This tool helps researchers track market dynamics and identify opportunities for innovation and growth.
Overview
About ChartFromText
ChartFromText is a free, user-friendly online tool that transforms plain text data into beautiful, professional charts in seconds. It’s designed to make data visualization accessible to everyone, regardless of their technical skills or design experience. The core idea is simple: you copy your data from a spreadsheet, document, or any text source, paste it into the tool, and instantly generate a visual chart. It supports various chart types, including pie charts, bar graphs, and line graphs, making it a versatile solution for many needs.
This tool is perfect for students who need to illustrate reports, educators creating engaging teaching materials, content creators looking to spice up their blogs or social media, and professionals who need quick charts for presentations or internal reports. ChartFromText eliminates the complexity and learning curve of traditional software like Excel or specialized design programs. There’s no need to create an account or deal with watermarks—it’s completely free and ready to use. With its focus on speed, simplicity, and high-quality output, ChartFromText empowers anyone to turn raw numbers into compelling visual stories effortlessly.
About Preuve AI
Preuve AI is an innovative startup validation tool designed to help founders assess their business ideas before investing significant time and resources into development. By allowing users to input their ideas in simple language, Preuve AI generates comprehensive, source-backed reports. These reports include a detailed competitor analysis, demand signals, market size estimates, pricing benchmarks, and key risks associated with the idea. Each claim in the report links to its source, ensuring transparency and credibility. With more than 3,500 startup ideas analyzed across 13 industries since its inception, Preuve AI aims to reduce the 42% failure rate of startups attributed to a lack of market need. Free scans provide quick insights, while paid reports unlock deeper analysis and actionable recommendations, making it a valuable resource for entrepreneurs looking to validate their ideas effectively.
Frequently Asked Questions
ChartFromText FAQ
What data format should I use?
The tool is designed to understand a simple, comma-separated format. Enter your data with each item on a new line, like this: Label, Value. For example: Marketing, 22000 or Apples, 45. You can copy this directly from a spreadsheet column or type it manually. The parser is smart and will handle it seamlessly.
Is ChartFromText really free?
Yes, absolutely! ChartFromText is a completely free online tool. There are no hidden costs, no subscription fees, and no premium features locked behind a paywall. You can create, customize, and download as many charts as you need without any limitations or watermarks on your images.
Do I need to create an account to use it?
No, you do not need an account. We value your privacy and convenience. You can access all features of ChartFromText immediately upon visiting the website. There is no sign-up process, no email required, and no login necessary to start creating and downloading your charts.
Can I create charts other than pie charts?
Yes! While the provided context highlights the pie chart generator, ChartFromText is designed to create multiple chart types. Based on the initial description, the tool also supports the creation of bar graphs and line graphs, giving you flexibility depending on what best represents your specific data set.
Preuve AI FAQ
How long does it take to receive a report from Preuve AI?
After submitting your idea, you can access a free scan in just 60 seconds. For a full Founder Report, it takes a little longer, but you will receive comprehensive insights typically within a few minutes.
What kind of data sources does Preuve AI scan?
Preuve AI analyzes over 40 live data sources, including popular platforms like Crunchbase, Google Trends, Reddit, Product Hunt, and G2, ensuring a well-rounded view of the market landscape.
Can I use Preuve AI for multiple ideas?
Yes, while free scans are limited to two per user, you can purchase additional Founder Reports for individual ideas at a one-time cost of $29 each, allowing you to validate multiple concepts effectively.
What if I am not satisfied with my report?
Preuve AI offers a 14-day report guarantee, meaning if you're not satisfied with the insights provided, you can reach out for support to discuss your concerns or request a review of your report.
Alternatives
ChartFromText Alternatives
ChartFromText is a free online tool in the data visualization and productivity category. It specializes in turning simple text into clear pie charts, bar graphs, and line graphs in seconds, making it a great choice for quick, simple charting needs. Users often explore other options for various reasons. Some might need more advanced chart types, deeper data analysis, or integration with other software platforms. Others may be looking for different pricing models, like a one-time purchase instead of a subscription, or require collaboration features for team projects. When evaluating other tools, consider your primary goal. If you need speed and simplicity for basic visuals, prioritize ease of use. For complex data stories, look for robust customization and export options. Also, think about where you'll use the charts—ensuring compatibility with your presentation software or website is key.
Preuve AI Alternatives
Preuve AI is a powerful tool designed to help entrepreneurs validate their startup ideas using real data instead of subjective opinions. Falling under the category of AI Assistants and Productivity & Management, it provides founders with comprehensive insights such as competitor analysis, market size, and viability scores. This encourages informed decision-making before investing time and resources into a project. Users often seek alternatives to Preuve AI for various reasons, including pricing, specific features that may not meet their unique needs, or compatibility with different platforms. When looking for an alternative, it's essential to consider the depth of analysis provided, the types of data sources utilized, and the overall user experience to ensure that the new tool aligns with your specific validation requirements.