ChartFromText vs VideoFlux
Side-by-side comparison to help you choose the right AI tool.
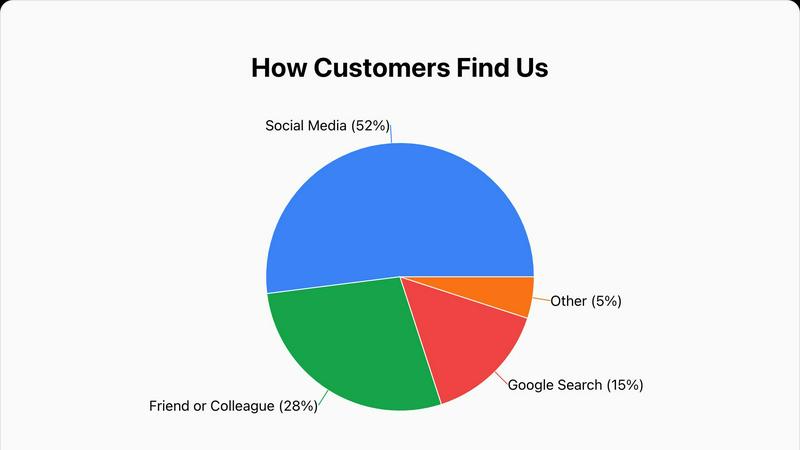
Instantly create beautiful pie charts from your text data in seconds with our free online generator.
Last updated: February 28, 2026
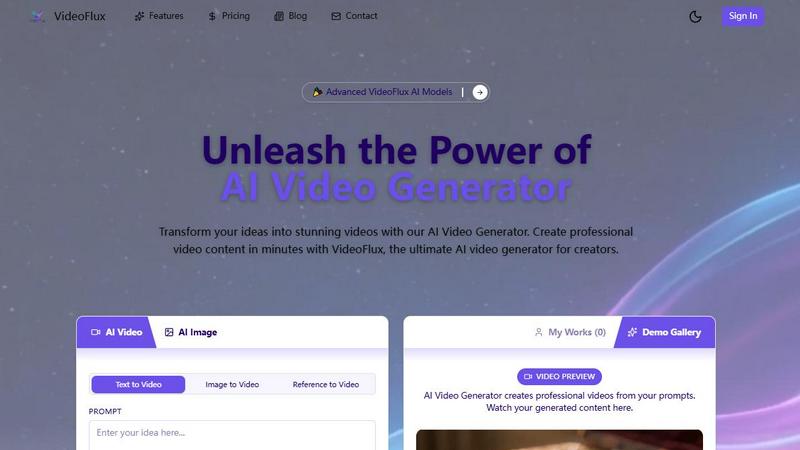
VideoFlux transforms your text and images into professional videos instantly with advanced AI.
Last updated: April 4, 2026
Visual Comparison
ChartFromText
VideoFlux
Feature Comparison
ChartFromText
Instant Text-to-Chart Conversion
The hallmark feature of ChartFromText is its ability to generate a chart directly from pasted text. You don't need to manually plot points or build complex tables. Simply copy data in a simple 'Label, Value' format from any source and paste it into the input field. The tool's smart parser understands the format instantly, converting your raw text into a structured visual chart within seconds, saving you immense time and effort.
Comprehensive Customization Options
While the process is simple, you still have full control over your chart's appearance. You can add a custom title, choose a background color to match your brand or presentation theme, and select how data labels are displayed. Options include showing values inside the chart slices, using connecting lines for clarity, or opting for a clean, separate legend. This flexibility ensures your final chart looks exactly how you envision it.
High-Resolution PNG Downloads
Every chart you create with ChartFromText can be downloaded as a high-resolution PNG image file. This ensures your visuals remain crisp, clear, and professional-looking whether they are embedded in a digital presentation, printed in a report, or shared online. You get a polished, ready-to-use graphic without any watermarks or quality loss.
Free & No-Account Required Access
ChartFromText is committed to being truly accessible. It is completely free to use with no hidden fees, subscription tiers, or premium feature locks. Most importantly, you can start creating and downloading charts immediately without having to sign up for an account or provide any personal information. This respects your privacy and gets you to your finished chart faster.
VideoFlux
Multiple AI Creation Modes
VideoFlux doesn't limit you to one starting point. It offers a versatile suite of tools including Text-to-Video, Image-to-Video, Text-to-Image, and Image-to-Image generation. This means you can type a prompt, upload a photo, or use a generated image as the foundation for your video. It’s designed to fit seamlessly into any creative workflow, allowing you to build upon your ideas step-by-step until you have the perfect visual narrative.
Advanced AI Model & Customization
The platform is powered by state-of-the-art AI models, like the upcoming Seedance 2.0, engineered to deliver professional-grade results with enhanced details. You have full control over the creative process with adjustable settings. Before generating, you can customize the aspect ratio (like 16:9 for widescreen), set the video duration, and apply different styles to ensure the final video perfectly matches your brand identity and creative vision.
Fast & High-Quality Generation
Say goodbye to waiting hours for renders. VideoFlux is built for speed, typically generating your videos in just 1 to 10 minutes. Despite the quick turnaround, the quality never suffers. The AI is fine-tuned to produce videos with smooth motion, cinematic qualities, and high-resolution details, making your content look polished and professional, ready for any platform.
Intuitive Project Management
VideoFlux provides a clean, user-friendly dashboard to streamline your entire creation process. Your "My Works" section keeps all your generated videos organized in one place. The platform also includes a Demo Gallery for inspiration, showing what’s possible with the AI. From sign-up to download, the workflow is straightforward, letting you focus on creativity rather than navigating a complicated interface.
Use Cases
ChartFromText
Student Assignments and Projects
Students can effortlessly elevate their essays, science fair projects, or research papers by adding professional-looking charts. Instead of describing data in paragraphs, they can paste survey results, experimental data, or historical figures from their notes directly into ChartFromText to create clear, impactful visuals that demonstrate understanding and improve their grades.
Business and Financial Presentations
Professionals can quickly generate charts for meetings, reports, or client proposals. Whether it's visualizing a project's budget allocation, showing quarterly sales breakdowns, or illustrating market share, ChartFromText turns spreadsheet data into compelling pie or bar charts in moments, making complex financial information easy for any audience to digest.
Educational Teaching Materials
Teachers and professors can use ChartFromText to create engaging visual aids for their lessons. By transforming statistical data, historical trends, or scientific proportions into charts, educators can explain concepts more clearly, capture students' attention, and provide visual handouts that enhance learning and retention in the classroom.
Content Creation for Blogs and Social Media
Bloggers, marketers, and social media managers can use ChartFromText to create eye-catching graphics for their content. Visualizing poll results, survey data, or simple statistics in a colorful pie or bar chart is a proven way to increase reader engagement, make articles more shareable, and present information in a snackable, visually appealing format.
VideoFlux
Social Media Content Creation
Content creators and influencers can use VideoFlux to consistently produce eye-catching clips for platforms like TikTok, Instagram Reels, and YouTube Shorts. Quickly generate trending visuals, animated stories, or promotional clips from simple text ideas or existing photos, keeping your feed fresh and engaging without a full production crew.
Marketing & Advertising Videos
Marketing teams and small businesses can create cost-effective ads, product demos, and brand story videos. Transform a product photo into a dynamic showcase video or write a prompt for a targeted ad scene. VideoFlux enables the rapid prototyping and creation of professional marketing assets that capture audience attention and drive conversions.
Creative Storytelling & Art
Artists, writers, and filmmakers can use VideoFlux as a brainstorming and visualization tool. Bring storyboard concepts to life, visualize scenes from a script, or create abstract art videos. The image-to-image and text-to-image features are perfect for experimenting with styles and compositions before committing to a final video concept.
Educational & Explainer Content
Educators, trainers, and course creators can develop compelling explainer videos and educational animations. Simply describe a complex concept (like "the water cycle" or "how a engine works"), and VideoFlux can generate a visual representation, making learning materials more engaging and easier to understand for students and trainees.
Overview
About ChartFromText
ChartFromText is a free, user-friendly online tool that transforms plain text data into beautiful, professional charts in seconds. It’s designed to make data visualization accessible to everyone, regardless of their technical skills or design experience. The core idea is simple: you copy your data from a spreadsheet, document, or any text source, paste it into the tool, and instantly generate a visual chart. It supports various chart types, including pie charts, bar graphs, and line graphs, making it a versatile solution for many needs.
This tool is perfect for students who need to illustrate reports, educators creating engaging teaching materials, content creators looking to spice up their blogs or social media, and professionals who need quick charts for presentations or internal reports. ChartFromText eliminates the complexity and learning curve of traditional software like Excel or specialized design programs. There’s no need to create an account or deal with watermarks—it’s completely free and ready to use. With its focus on speed, simplicity, and high-quality output, ChartFromText empowers anyone to turn raw numbers into compelling visual stories effortlessly.
About VideoFlux
VideoFlux is your creative partner for turning ideas into professional-quality videos in minutes. It's an advanced AI-powered platform designed to simplify video creation for everyone, from social media creators and marketers to business owners and artists. At its core, VideoFlux transforms simple text descriptions or static images into dynamic, engaging video content. Whether you need a short ad, a social media clip, or a creative visual story, VideoFlux handles it. The platform offers multiple creation paths: describe a scene with words using Text-to-Video, bring a photo to life with Image-to-Video, generate images from text, or transform existing images into new styles. This flexibility means you can start your project from any point of inspiration. Built with cutting-edge AI models, VideoFlux prioritizes high-quality output, fast processing times (typically 1-10 minutes), and an intuitive workflow. It’s the perfect solution for anyone looking to produce stunning video content quickly, cost-effectively, and without needing complex editing skills or expensive production teams.
Frequently Asked Questions
ChartFromText FAQ
What data format should I use?
The tool is designed to understand a simple, comma-separated format. Enter your data with each item on a new line, like this: Label, Value. For example: Marketing, 22000 or Apples, 45. You can copy this directly from a spreadsheet column or type it manually. The parser is smart and will handle it seamlessly.
Is ChartFromText really free?
Yes, absolutely! ChartFromText is a completely free online tool. There are no hidden costs, no subscription fees, and no premium features locked behind a paywall. You can create, customize, and download as many charts as you need without any limitations or watermarks on your images.
Do I need to create an account to use it?
No, you do not need an account. We value your privacy and convenience. You can access all features of ChartFromText immediately upon visiting the website. There is no sign-up process, no email required, and no login necessary to start creating and downloading your charts.
Can I create charts other than pie charts?
Yes! While the provided context highlights the pie chart generator, ChartFromText is designed to create multiple chart types. Based on the initial description, the tool also supports the creation of bar graphs and line graphs, giving you flexibility depending on what best represents your specific data set.
VideoFlux FAQ
What types of videos can I create with VideoFlux?
You can create a wide variety of videos, including marketing clips, social media content, advertisements, creative art pieces, product showcases, and educational explainers. The AI is versatile and can interpret many different prompts and styles, from realistic scenes to more abstract and artistic visuals.
How long does it take to generate a video?
Generation time is typically between 1 to 10 minutes, depending on the complexity of your prompt, the selected settings, and the current server load. VideoFlux is optimized for speed to help you create content quickly without sacrificing the high-quality output you expect.
Do I need video editing experience to use VideoFlux?
Not at all! VideoFlux is designed to be user-friendly for everyone. The process is as simple as typing a description or uploading an image, adjusting a few basic settings like aspect ratio and duration, and clicking generate. The AI handles the complex creation process, delivering a ready-to-use video file.
What support is available if I need help?
VideoFlux offers dedicated support to all users. You can reach out to their team directly via email at [email protected] for technical assistance or guidance. They also encourage users to join their creator community to connect with other users, share tips, and find inspiration.
Alternatives
ChartFromText Alternatives
ChartFromText is a free online tool in the data visualization and productivity category. It specializes in turning simple text into clear pie charts, bar graphs, and line graphs in seconds, making it a great choice for quick, simple charting needs. Users often explore other options for various reasons. Some might need more advanced chart types, deeper data analysis, or integration with other software platforms. Others may be looking for different pricing models, like a one-time purchase instead of a subscription, or require collaboration features for team projects. When evaluating other tools, consider your primary goal. If you need speed and simplicity for basic visuals, prioritize ease of use. For complex data stories, look for robust customization and export options. Also, think about where you'll use the charts—ensuring compatibility with your presentation software or website is key.
VideoFlux Alternatives
VideoFlux is an AI-powered tool in the content creation and design space, specifically focused on generating videos from text prompts and images. It helps users quickly produce marketing materials, social media clips, and ads by converting simple inputs into professional-looking video content. People often explore other options for various reasons. This could be due to budget constraints, a need for different video styles or formats, or a requirement to integrate with other platforms in their workflow. Sometimes, a project just demands a specific feature that their current tool doesn't offer. When evaluating different platforms, it's wise to consider your primary use case, desired output quality, and how much creative control you need. Also, look at factors like generation speed, ease of use, and the overall cost relative to the value you expect to get from the tool.