Dividend Data vs MySeasonColors
Side-by-side comparison to help you choose the right AI tool.
Dividend Data
Get data & 30+ yrs history in Sheets/Excel fast.
MySeasonColors
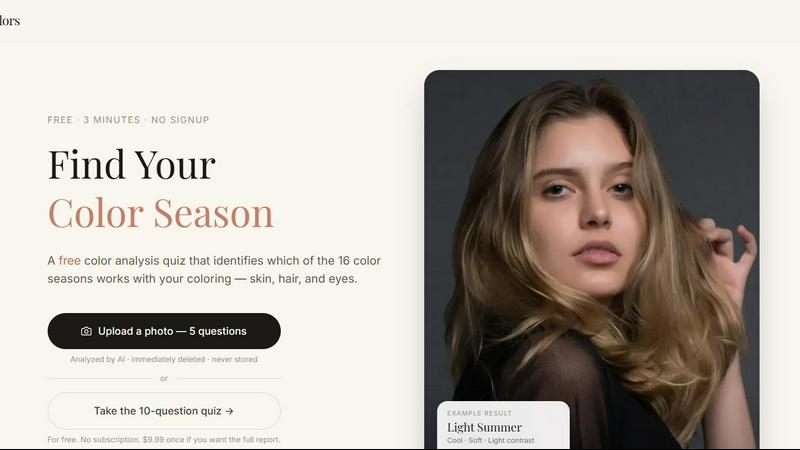
Dress in colors that actually flatter you — free 16-season color analysis.
Visual Comparison
Dividend Data

MySeasonColors
Overview
About Dividend Data
Dividend Data brings 30+ years of stock market data for 80,000+ tickers directly into your Google Sheets and Microsoft Excel spreadsheets — no API keys, no coding, no copying and pasting.
Built for dividend & fundamental investors, it gives you instant access to dividends, yields, payout ratios, growth rates, financial statements, earnings, ratios, price history, and 100+ metrics through simple custom formulas.
Just type a formula. The data appears live.
What makes it different:
• Free tier with 2,500 monthly credits — no trial expiration
• 16 custom functions covering everything dividend investors need
• 30+ years of historical data
• Works in both Google Sheets and Microsoft Excel
• Built by a dividend investor, for dividend investors
Used by fundamental investors who want institutional-grade data without the institutional price tag.
About MySeasonColors
MySeasonColors is a free online color analysis quiz based on the 16-season system. In just a few minutes, you answer questions about your skin tone, hair, and eye color — or upload a photo for AI-assisted prefill — and receive your personal color season for free. For deeper results, the $9.99 full report includes your complete color palette, makeup and hair color guide, wardrobe strategy, colors to avoid, and a printable wallet card. Whether you're new to color analysis or refining your style, MySeasonColors makes it simple, accurate, and accessible.