Dividend Data vs The World Now
Side-by-side comparison to help you choose the right AI tool.
Dividend Data
Instantly pull stock dividends, prices, and financials directly into your Google Sheets or Excel spreadsheets.
Last updated: March 11, 2026
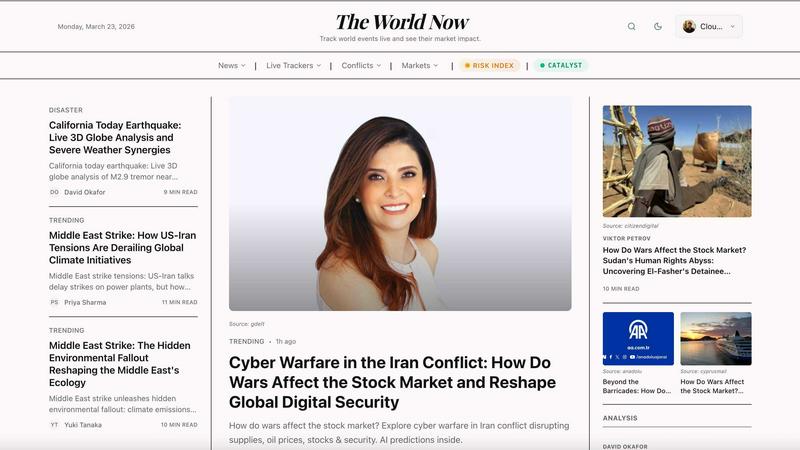
The World Now
The World Now is a live 3D globe that tracks global risks and shows you their real impact on markets.
Last updated: March 26, 2026
Visual Comparison
Dividend Data

The World Now
Feature Comparison
Dividend Data
Extensive Spreadsheet Functions
Dividend Data provides 16 custom, easy-to-use functions that cover every essential data point for fundamental analysis. Simply type formulas like =DIVIDENDDATA_DIVIDENDS("TICKER") or =DIVIDENDDATA_RATIOS("TICKER", "PeRatio") and the live data instantly populates your cell. These functions pull from a vast database, giving you one-click access to forward dividends, ex-dates, financial metrics, and real-time quotes, transforming your spreadsheet into a dynamic research terminal.
Decades of Historical Data
Access over 30 years of clean, reliable historical market data for a comprehensive long-term view. This deep historical context is crucial for analyzing dividend growth trends, assessing company performance through multiple economic cycles, and building robust financial models. Whether you're backtesting a strategy or calculating a 10-year dividend growth rate, you have the historical depth needed for thorough due diligence.
Cross-Platform Compatibility
The tool works seamlessly in both Google Sheets and Microsoft Excel environments. You can download it as an add-in from the Microsoft AppSource or install it as a Google Workspace add-on. This flexibility ensures teams and individual investors can use their preferred spreadsheet software without sacrificing functionality, making collaboration and data consistency easy across different platforms.
Built for Fundamental & Dividend Investors
Every feature is crafted with the needs of income and value investors in mind. The data focuses on dividend sustainability (payout ratios, growth rates), fundamental health (financial statements, earnings), and key valuation metrics. It cuts through the noise to deliver the specific data points—like next ex-dividend date or forward yield—that are most critical for building and managing a dividend-focused portfolio.
The World Now
Live Interactive 3D Globe
Visualize global events as they happen on a dynamic, rotating 3D globe. This feature updates every five minutes, plotting the precise locations of earthquakes, volcanic eruptions, active conflicts, missile strikes, and wildfires. It pulls verified data from sources like USGS and NASA, allowing you to grasp the geographical scale and proximity of events instantly, making global awareness intuitive and engaging.
Catalyst AI Market Prediction Engine
This is the core intelligence behind the platform. Catalyst AI analyzes live geopolitical and environmental events to predict their impact on financial markets. It provides severity ratings, directional forecasts (up or down), and a published track record for 28 assets. For example, it can forecast how a new escalation in the Middle East might affect oil prices or Bitcoin within hours, giving you a quantifiable edge.
AI-Generated Breaking News & Analysis
Within minutes of detecting a significant event, The World Now's AI generates concise, factual breaking news summaries. This feature ensures you are informed almost as fast as the event occurs, far ahead of traditional news cycles. These summaries are complemented by deeper analytical articles from expert contributors, providing context on events like the Russia-Ukraine war or the economic fallout from a disaster.
Global Risk Index & Specialized Trackers
The platform synthesizes complex data into easy-to-understand metrics. The Global Risk Index combines conflict, disaster, and economic stress into a single score for countries. Additionally, over 30 dedicated tracker pages let you monitor specific themes like current wars, earthquake activity, or the Doomsday Clock, offering focused insights into the areas you care about most.
Use Cases
Dividend Data
Automated Dividend Portfolio Tracking
Manually updating a portfolio spreadsheet with current yields, dividend dates, and payment amounts is a chore. With Dividend Data, you can create a master watchlist or portfolio tracker where all these figures update automatically. Set formulas once for tickers like MSFT or KO, and your sheet will always display the latest forward dividend, yield, and next ex-date, saving hours of maintenance each month.
Screening and Comparative Analysis
Quickly screen and compare potential investments directly in your spreadsheet. Use the functions to pull key ratios like P/E, P/B, or debt-to-equity for a list of stocks side-by-side. Analyze dividend growth rates or payout ratios across sectors to identify the most financially stable and shareholder-friendly companies, all without ever leaving your familiar analytical environment.
Building Dynamic Financial Models
Create powerful, auto-updating discounted cash flow (DCF) models or dividend discount models (DDM). Link your model assumptions directly to live data feeds for revenue, EPS, and dividend per share. This ensures your valuation models are always based on the most recent reported figures, making your investment thesis and price targets more accurate and timely.
Educational Research and Backtesting
Ideal for students, bloggers, and investors honing their skills. Easily pull 10 years of dividend history to chart a company's growth trajectory or analyze how a stock's valuation multiples have changed over time. Test historical investment rules or strategies by building sheets that leverage decades of price and fundamental data for robust, evidence-based learning.
The World Now
Proactive Investment & Portfolio Management
Traders and fund managers use The World Now to anticipate market volatility. By receiving AI-driven alerts on how an event might impact specific assets, they can adjust positions, hedge risks, or identify new opportunities before the broader market fully reacts, turning global uncertainty into a strategic advantage.
Journalistic Research & Reporting
Journalists and researchers leverage the platform to discover and verify breaking stories. The live globe and AI news summaries provide immediate leads and factual context, while the market impact forecasts add a valuable financial dimension to their reporting on conflicts, disasters, or political crises.
Corporate Risk & Supply Chain Analysis
Businesses with global operations use the Country Danger Rankings and Global Risk Index to monitor the stability of regions where they have offices, suppliers, or customers. This helps in proactive risk assessment, ensuring business continuity and safeguarding assets against geopolitical or environmental disruptions.
Personal Awareness & Travel Planning
For frequent travelers, analysts, or simply globally-minded citizens, the platform offers a clear, real-time view of global safety. Checking the Risk Index and live disaster trackers provides crucial information for making informed decisions about travel itineraries and understanding the context behind world headlines.
Overview
About Dividend Data
Dividend Data is a powerful financial data platform designed to bring institutional-grade stock market information directly into the tools you already use every day: Google Sheets and Microsoft Excel. It eliminates the tedious, error-prone process of manually copying and pasting data from financial websites. Instead, you get instant, live access to over 30 years of historical data for more than 80,000 tickers through simple, custom spreadsheet formulas. Built specifically by and for dividend and fundamental investors, it provides a comprehensive suite of data points including dividend amounts, yields, payout ratios, growth rates, complete financial statements, key valuation ratios, and real-time price history. The core value proposition is powerful simplicity: you get the deep data needed for serious investment analysis without needing API keys, coding skills, or a massive budget. With a generous free tier offering 2,500 monthly credits that never expire, it's built to empower every investor to make more informed, data-driven decisions right from their spreadsheet.
About The World Now
The World Now is your real-time window into a changing world, designed to connect global events directly to market movements. It's more than just a news aggregator; it's an intelligence platform that tracks live conflicts, natural disasters, and geopolitical crises on a stunning interactive 3D globe. What truly sets it apart is Catalyst, its proprietary AI prediction engine. Catalyst analyzes these unfolding events to forecast their potential impact on 28 key financial assets, including Bitcoin, gold, oil, and major stock indices. This means you get not only the "what" and "where" of a global event but also a data-driven prediction of the "so what" for markets. Built for investors, analysts, journalists, and anyone who needs to understand the implications of world events faster than traditional media can report, The World Now delivers clarity and foresight. It transforms the overwhelming flow of global data into actionable insights, helping you see the connections between a breaking news alert and your portfolio's performance.
Frequently Asked Questions
Dividend Data FAQ
How does the free tier work?
The free tier is remarkably generous and designed to be permanently useful. You receive 2,500 credits every month, which do not expire and refresh on a monthly cycle. Each data pull using a formula typically costs 1 credit. This allows for substantial usage, such as updating a portfolio of 50 stocks with several data points each month, completely free of charge and without any trial period pressure.
Do I need to know how to code or use APIs?
Absolutely not. Dividend Data requires zero coding knowledge or API integration. The entire system works through simple spreadsheet formulas that anyone familiar with basic Excel or Google Sheets functions can use. You just type the formula with the stock ticker, and the data appears instantly—no technical setup, key management, or complex configuration is needed.
What kind of data can I access?
You have access to a comprehensive suite of data critical for fundamental analysis. This includes dividend data (amounts, yields, dates, growth), real-time quotes and price history, complete financial statements (income, balance sheet, cash flow), and over 100 key financial ratios (valuation, profitability, liquidity). The database covers 80,000+ global tickers with 30+ years of history.
Is my data secure and private?
Yes. Dividend Data operates with a strong commitment to privacy. Your spreadsheet data and portfolio information are not stored on their servers. The add-in/plug-in facilitates a direct data pull into your sheet. You are in complete control of your data within your own spreadsheet file, which resides in your Google Drive or on your local computer.
The World Now FAQ
How accurate are the AI market predictions from Catalyst?
Catalyst is built on continuously learning models trained on historical correlations between event types and market reactions. While no prediction is 100% certain, Catalyst provides a data-driven probabilistic forecast, complete with severity ratings and a published track record for transparency. It is designed to identify potential impact and direction, serving as a powerful early-warning system rather than a crystal ball.
What sources does The World Now use for its event data?
The platform aggregates and verifies data from a wide range of reputable, real-time sources. These include geological agencies like the USGS for earthquakes, satellite data from NASA FIRMS for wildfires, conflict databases like ACLED, and global news monitoring through GDELT. This multi-source approach ensures comprehensive and reliable event detection.
Is The World Now free to use?
Yes, the core real-time tracking on the interactive 3D globe is free for anyone to use. This includes viewing live events, accessing the Risk Index, and reading a selection of news and analysis. Some advanced features, particularly the detailed Catalyst AI forecasts and certain in-depth analytical reports, may be part of premium subscription offerings.
How quickly does the platform update after a major event?
The system is designed for speed. The 3D globe and event databases refresh every 5 minutes. More importantly, the AI breaking news engine can generate and publish a summary of a significant event within minutes of its detection by the data network, ensuring you are among the first to know.
Alternatives
Dividend Data Alternatives
Dividend Data is a specialized tool that brings over 30 years of stock market data directly into your spreadsheets. It falls into the category of financial data providers, specifically designed for investors who focus on dividends and company fundamentals. Users often explore other options to find the best fit for their specific needs. People look for alternatives for various reasons. This could be due to budget constraints, a need for different features not offered, or because they primarily use a platform that isn't supported. Some may require more advanced analytical tools or a different data delivery method. When evaluating other services, consider what's most important for your workflow. Key factors include the depth and accuracy of historical data, the cost relative to your usage, compatibility with your preferred spreadsheet software, and how easily you can access the specific metrics you need without a technical hassle.
The World Now Alternatives
The World Now is a specialized business and finance tool that provides real-time global risk tracking on a 3D globe. It connects geopolitical events like conflicts and natural disasters directly to potential market movements, serving investors and professionals who need an information edge. People often explore alternatives for various reasons. Some may be looking for a different pricing model or a free version with basic features. Others might need a platform that focuses more narrowly on a specific area, like pure disaster monitoring or traditional financial news, without the integrated AI market predictions. Platform compatibility, such as a mobile-first experience or a specific operating system, can also drive the search. When evaluating other options, consider your primary need. Do you require the live visual context of a 3D globe, or is a map or list sufficient? How important are AI-driven market forecasts versus raw event data? Also, assess the speed of information delivery, the breadth of risk factors covered, and the depth of analysis provided for the assets you care about most.