Dividend Data vs Easy IRR Calculator
Side-by-side comparison to help you choose the right AI tool.
Dividend Data
Instantly pull stock dividends, prices, and financials directly into your Google Sheets or Excel spreadsheets.
Last updated: March 11, 2026

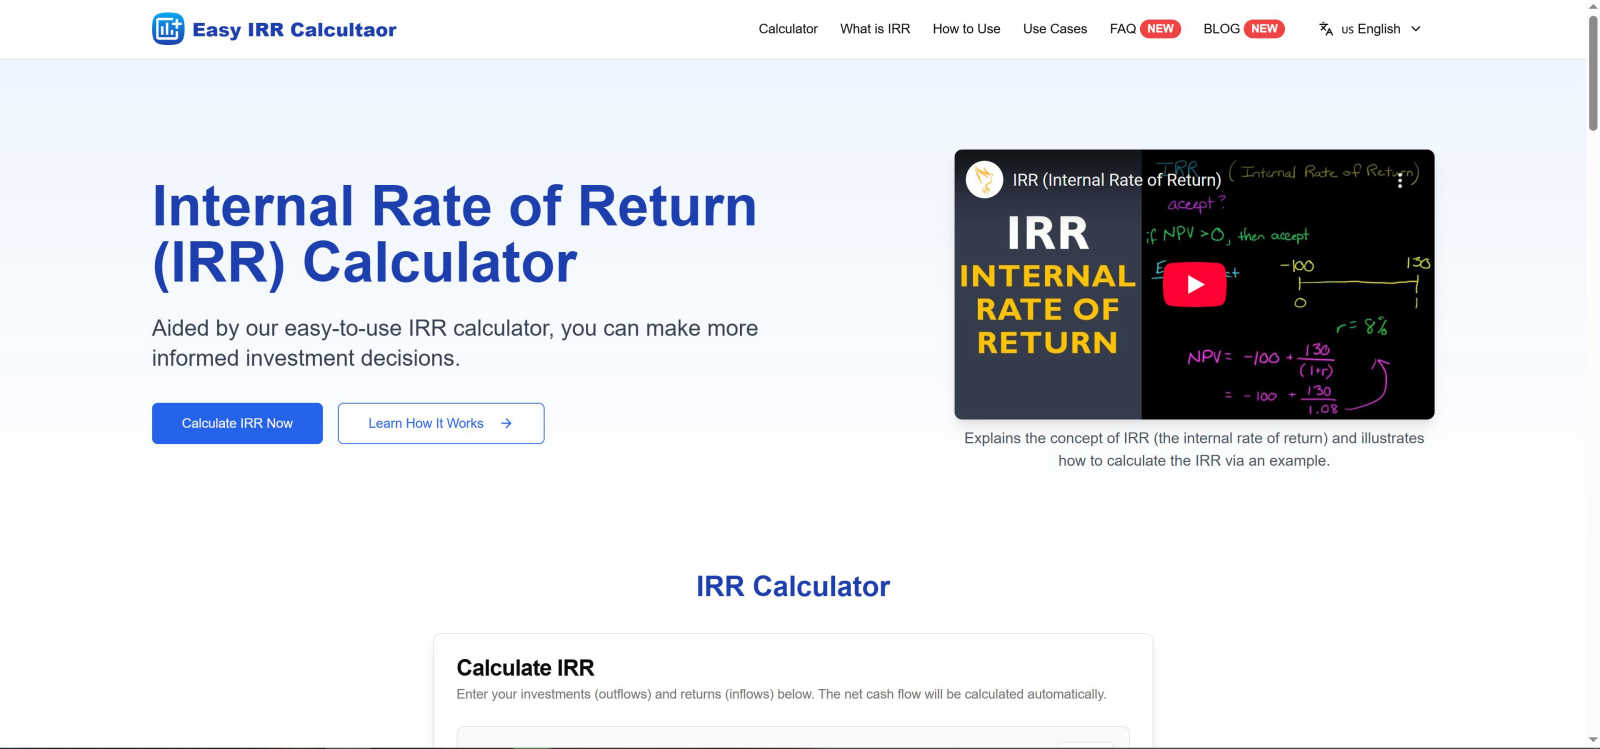
Easy IRR Calculator
Easily calculate your investments' internal rate of return to make smarter, informed financial decisions.
Last updated: March 1, 2026
Visual Comparison
Dividend Data

Easy IRR Calculator
Feature Comparison
Dividend Data
Extensive Spreadsheet Functions
Dividend Data provides 16 custom, easy-to-use functions that cover every essential data point for fundamental analysis. Simply type formulas like =DIVIDENDDATA_DIVIDENDS("TICKER") or =DIVIDENDDATA_RATIOS("TICKER", "PeRatio") and the live data instantly populates your cell. These functions pull from a vast database, giving you one-click access to forward dividends, ex-dates, financial metrics, and real-time quotes, transforming your spreadsheet into a dynamic research terminal.
Decades of Historical Data
Access over 30 years of clean, reliable historical market data for a comprehensive long-term view. This deep historical context is crucial for analyzing dividend growth trends, assessing company performance through multiple economic cycles, and building robust financial models. Whether you're backtesting a strategy or calculating a 10-year dividend growth rate, you have the historical depth needed for thorough due diligence.
Cross-Platform Compatibility
The tool works seamlessly in both Google Sheets and Microsoft Excel environments. You can download it as an add-in from the Microsoft AppSource or install it as a Google Workspace add-on. This flexibility ensures teams and individual investors can use their preferred spreadsheet software without sacrificing functionality, making collaboration and data consistency easy across different platforms.
Built for Fundamental & Dividend Investors
Every feature is crafted with the needs of income and value investors in mind. The data focuses on dividend sustainability (payout ratios, growth rates), fundamental health (financial statements, earnings), and key valuation metrics. It cuts through the noise to deliver the specific data points—like next ex-dividend date or forward yield—that are most critical for building and managing a dividend-focused portfolio.
Easy IRR Calculator
User-Friendly Interface
The Easy IRR Calculator features a clean and intuitive design that allows users to input cash flows effortlessly. You can quickly add or remove investment periods, making it easy to adjust your calculations as needed.
Dual Calculation Methods
Our IRR Calculator employs two robust numerical methods: the Newton-Raphson method for fast convergence and the Bisection method for guaranteed results. This dual approach provides users with comprehensive insights into investment performance.
Automatic Cash Flow Calculation
As you input your investment and return figures, the Easy IRR Calculator automatically calculates the net cash flow. This feature saves time and reduces the risk of errors, allowing users to focus on decision-making.
Scenario Comparison
With the 'Reset' button, users can easily clear all data and test different investment scenarios. This feature encourages exploration of various cash flow arrangements to identify the most profitable options.
Use Cases
Dividend Data
Automated Dividend Portfolio Tracking
Manually updating a portfolio spreadsheet with current yields, dividend dates, and payment amounts is a chore. With Dividend Data, you can create a master watchlist or portfolio tracker where all these figures update automatically. Set formulas once for tickers like MSFT or KO, and your sheet will always display the latest forward dividend, yield, and next ex-date, saving hours of maintenance each month.
Screening and Comparative Analysis
Quickly screen and compare potential investments directly in your spreadsheet. Use the functions to pull key ratios like P/E, P/B, or debt-to-equity for a list of stocks side-by-side. Analyze dividend growth rates or payout ratios across sectors to identify the most financially stable and shareholder-friendly companies, all without ever leaving your familiar analytical environment.
Building Dynamic Financial Models
Create powerful, auto-updating discounted cash flow (DCF) models or dividend discount models (DDM). Link your model assumptions directly to live data feeds for revenue, EPS, and dividend per share. This ensures your valuation models are always based on the most recent reported figures, making your investment thesis and price targets more accurate and timely.
Educational Research and Backtesting
Ideal for students, bloggers, and investors honing their skills. Easily pull 10 years of dividend history to chart a company's growth trajectory or analyze how a stock's valuation multiples have changed over time. Test historical investment rules or strategies by building sheets that leverage decades of price and fundamental data for robust, evidence-based learning.
Easy IRR Calculator
Business Project Evaluation
The Easy IRR Calculator is invaluable for businesses evaluating potential projects. It helps managers assess the profitability of different initiatives, enabling them to make informed decisions that could lead to increased revenue.
Real Estate Investment Analysis
Investors in real estate can use the IRR Calculator to compare potential property investments. By inputting cash flows from different properties, they can make better decisions about where to allocate their resources.
Portfolio Performance Assessment
Financial analysts can leverage the Easy IRR Calculator to evaluate the performance of stock portfolios. By analyzing the IRR of various investments, they can identify the most promising assets to hold or sell.
Financial Planning for Startups
Entrepreneurs can benefit from the IRR Calculator when planning their startup ventures. By estimating cash inflows and outflows, they can determine the viability of their business models and secure funding more effectively.
Overview
About Dividend Data
Dividend Data is a powerful financial data platform designed to bring institutional-grade stock market information directly into the tools you already use every day: Google Sheets and Microsoft Excel. It eliminates the tedious, error-prone process of manually copying and pasting data from financial websites. Instead, you get instant, live access to over 30 years of historical data for more than 80,000 tickers through simple, custom spreadsheet formulas. Built specifically by and for dividend and fundamental investors, it provides a comprehensive suite of data points including dividend amounts, yields, payout ratios, growth rates, complete financial statements, key valuation ratios, and real-time price history. The core value proposition is powerful simplicity: you get the deep data needed for serious investment analysis without needing API keys, coding skills, or a massive budget. With a generous free tier offering 2,500 monthly credits that never expire, it's built to empower every investor to make more informed, data-driven decisions right from their spreadsheet.
About Easy IRR Calculator
Welcome to the Easy IRR Calculator, your essential tool for navigating the complexities of investment analysis. This powerful yet user-friendly software simplifies the calculation of the Internal Rate of Return (IRR), allowing you to make more informed investment decisions with confidence. Designed for financial professionals, analysts, business owners, and savvy investors, the Easy IRR Calculator transforms what is often a complicated financial metric into a straightforward process. By determining the annualized profitability of potential investments, it finds the discount rate that makes the net present value (NPV) of all cash flows equal to zero. Our commitment to simplicity without sacrificing robustness ensures that you have access to a clean interface while enjoying the benefits of our dual-method calculation engine. Whether you are evaluating a new business project, comparing real estate deals, or analyzing stock portfolios, the Easy IRR Calculator provides reliable metrics to help you focus on maximizing your returns.
Frequently Asked Questions
Dividend Data FAQ
How does the free tier work?
The free tier is remarkably generous and designed to be permanently useful. You receive 2,500 credits every month, which do not expire and refresh on a monthly cycle. Each data pull using a formula typically costs 1 credit. This allows for substantial usage, such as updating a portfolio of 50 stocks with several data points each month, completely free of charge and without any trial period pressure.
Do I need to know how to code or use APIs?
Absolutely not. Dividend Data requires zero coding knowledge or API integration. The entire system works through simple spreadsheet formulas that anyone familiar with basic Excel or Google Sheets functions can use. You just type the formula with the stock ticker, and the data appears instantly—no technical setup, key management, or complex configuration is needed.
What kind of data can I access?
You have access to a comprehensive suite of data critical for fundamental analysis. This includes dividend data (amounts, yields, dates, growth), real-time quotes and price history, complete financial statements (income, balance sheet, cash flow), and over 100 key financial ratios (valuation, profitability, liquidity). The database covers 80,000+ global tickers with 30+ years of history.
Is my data secure and private?
Yes. Dividend Data operates with a strong commitment to privacy. Your spreadsheet data and portfolio information are not stored on their servers. The add-in/plug-in facilitates a direct data pull into your sheet. You are in complete control of your data within your own spreadsheet file, which resides in your Google Drive or on your local computer.
Easy IRR Calculator FAQ
What is the Internal Rate of Return (IRR)?
The Internal Rate of Return (IRR) is the annualized rate at which the net present value (NPV) of all cash flows from an investment equals zero. It helps assess the profitability of potential investments.
How do I input data into the Easy IRR Calculator?
To use the calculator, simply enter your initial investment as a negative value and subsequent cash inflows as positive values for each period. The calculator will automatically compute the net cash flow.
What methods does the calculator use to compute IRR?
The Easy IRR Calculator employs two primary methods: the Newton-Raphson method for quick convergence and the Bisection method for accuracy. This dual approach ensures reliable results.
Can I compare multiple investment scenarios?
Yes, the Easy IRR Calculator allows you to easily reset and input different cash flow scenarios. This feature enables you to compare multiple investment opportunities to find the most lucrative options.
Alternatives
Dividend Data Alternatives
Dividend Data is a specialized tool that brings over 30 years of stock market data directly into your spreadsheets. It falls into the category of financial data providers, specifically designed for investors who focus on dividends and company fundamentals. Users often explore other options to find the best fit for their specific needs. People look for alternatives for various reasons. This could be due to budget constraints, a need for different features not offered, or because they primarily use a platform that isn't supported. Some may require more advanced analytical tools or a different data delivery method. When evaluating other services, consider what's most important for your workflow. Key factors include the depth and accuracy of historical data, the cost relative to your usage, compatibility with your preferred spreadsheet software, and how easily you can access the specific metrics you need without a technical hassle.
Easy IRR Calculator Alternatives
The Easy IRR Calculator is a user-friendly tool designed to simplify the calculation of the Internal Rate of Return (IRR), making it a valuable resource for financial professionals, analysts, business owners, and investors. As part of the Business & Finance category, it focuses on helping users make informed investment decisions by providing clear and reliable profitability figures. Users often seek alternatives for various reasons, such as pricing constraints, specific feature sets, or compatibility with different platforms. When searching for an alternative, it's essential to consider aspects like ease of use, the accuracy of calculations, and the ability to manage cash flows effectively. A good alternative should also offer a balance between functionality and user experience to ensure you can make sound financial decisions without unnecessary complexity.