Dividend Data vs Prediction Pulse
Side-by-side comparison to help you choose the right AI tool.
Dividend Data
Instantly pull stock dividends, prices, and financials directly into your Google Sheets or Excel spreadsheets.
Last updated: March 11, 2026
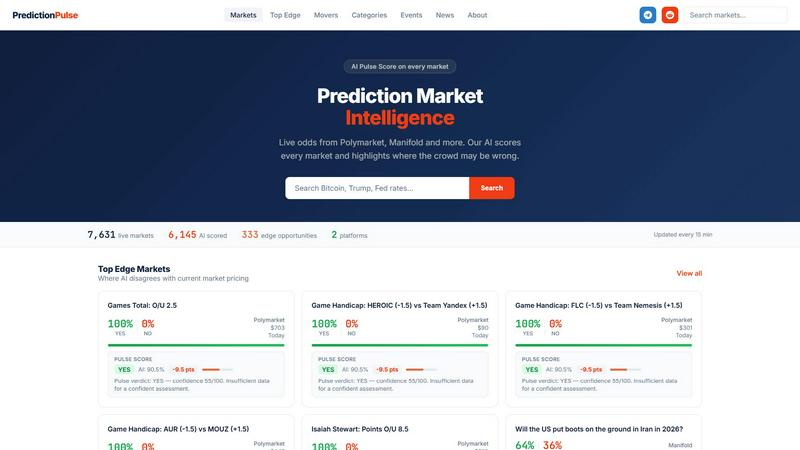
Prediction Pulse
Prediction Pulse uses AI to find betting markets where the crowd's odds might be wrong, giving you a smarter edge.
Last updated: March 18, 2026
Visual Comparison
Dividend Data

Prediction Pulse
Feature Comparison
Dividend Data
Extensive Spreadsheet Functions
Dividend Data provides 16 custom, easy-to-use functions that cover every essential data point for fundamental analysis. Simply type formulas like =DIVIDENDDATA_DIVIDENDS("TICKER") or =DIVIDENDDATA_RATIOS("TICKER", "PeRatio") and the live data instantly populates your cell. These functions pull from a vast database, giving you one-click access to forward dividends, ex-dates, financial metrics, and real-time quotes, transforming your spreadsheet into a dynamic research terminal.
Decades of Historical Data
Access over 30 years of clean, reliable historical market data for a comprehensive long-term view. This deep historical context is crucial for analyzing dividend growth trends, assessing company performance through multiple economic cycles, and building robust financial models. Whether you're backtesting a strategy or calculating a 10-year dividend growth rate, you have the historical depth needed for thorough due diligence.
Cross-Platform Compatibility
The tool works seamlessly in both Google Sheets and Microsoft Excel environments. You can download it as an add-in from the Microsoft AppSource or install it as a Google Workspace add-on. This flexibility ensures teams and individual investors can use their preferred spreadsheet software without sacrificing functionality, making collaboration and data consistency easy across different platforms.
Built for Fundamental & Dividend Investors
Every feature is crafted with the needs of income and value investors in mind. The data focuses on dividend sustainability (payout ratios, growth rates), fundamental health (financial statements, earnings), and key valuation metrics. It cuts through the noise to deliver the specific data points—like next ex-dividend date or forward yield—that are most critical for building and managing a dividend-focused portfolio.
Prediction Pulse
AI Pulse Score Engine
At the heart of Prediction Pulse is its proprietary Pulse Score. This AI engine analyzes every single market, processing vast amounts of data to generate its own independent probability estimate. It then compares this "AI odds" against the current market price, visually highlighting discrepancies. This allows you to instantly see where the AI has high confidence or spots a potential edge, complete with a verdict and confidence level to guide your assessment.
Cross-Platform Market Aggregation
Instead of jumping between different prediction market sites, Prediction Pulse brings everything together in one place. It continuously aggregates and updates live markets from leading platforms like Polymarket and Manifold, giving you a unified view of over 29,000 active markets. This saves you time and ensures you have a comprehensive picture of all available trading activity and liquidity across the ecosystem, updated every 15 minutes.
Event-Centric Organization
Prediction markets can be chaotic, with multiple questions on the same topic. Prediction Pulse intelligently groups related markets into canonical "Events." This means you can explore a single page for a major event like an election or a geopolitical development, see all the different market questions surrounding it, and understand the collective signal, making research and tracking much more intuitive and efficient.
AI-Generated Market News & Insights
Stay informed without constant manual monitoring. Prediction Pulse features an AI-generated news feed that covers major movements and interesting developments across prediction markets. This content explains significant price swings, highlights new high-volume markets, and provides context, helping you quickly catch up on what matters and understand the narratives driving market sentiment.
Use Cases
Dividend Data
Automated Dividend Portfolio Tracking
Manually updating a portfolio spreadsheet with current yields, dividend dates, and payment amounts is a chore. With Dividend Data, you can create a master watchlist or portfolio tracker where all these figures update automatically. Set formulas once for tickers like MSFT or KO, and your sheet will always display the latest forward dividend, yield, and next ex-date, saving hours of maintenance each month.
Screening and Comparative Analysis
Quickly screen and compare potential investments directly in your spreadsheet. Use the functions to pull key ratios like P/E, P/B, or debt-to-equity for a list of stocks side-by-side. Analyze dividend growth rates or payout ratios across sectors to identify the most financially stable and shareholder-friendly companies, all without ever leaving your familiar analytical environment.
Building Dynamic Financial Models
Create powerful, auto-updating discounted cash flow (DCF) models or dividend discount models (DDM). Link your model assumptions directly to live data feeds for revenue, EPS, and dividend per share. This ensures your valuation models are always based on the most recent reported figures, making your investment thesis and price targets more accurate and timely.
Educational Research and Backtesting
Ideal for students, bloggers, and investors honing their skills. Easily pull 10 years of dividend history to chart a company's growth trajectory or analyze how a stock's valuation multiples have changed over time. Test historical investment rules or strategies by building sheets that leverage decades of price and fundamental data for robust, evidence-based learning.
Prediction Pulse
Identifying Trading Opportunities
Traders can use the "Top Edge Markets" section to quickly scan for opportunities where the AI's Pulse Score significantly disagrees with the current market price. A large discrepancy might indicate a market mispricing, allowing a trader to place a contrarian bet based on the AI's analysis before the market corrects itself, potentially securing better odds.
Research and Trend Analysis
Researchers, journalists, and analysts can use Prediction Pulse to gauge public sentiment on future events. By examining the aggregated probabilities on events like elections, policy changes, or technological milestones, they can access a quantitative measure of collective intelligence to supplement traditional research and identify emerging trends or consensus views.
Market Due Diligence
Before placing a bet on a specific market, a user can leverage Prediction Pulse for due diligence. They can check the AI's verdict and confidence level, see if related markets on other platforms tell a different story, and read any AI-generated news about that event. This provides a more robust, multi-angle view to inform their final decision.
Casual Observation and Learning
For someone simply curious about prediction markets, Prediction Pulse offers an accessible entry point. The event pages and AI explanations demystify complex markets. You can follow intriguing questions, see how crowd wisdom evolves on topics you care about, and learn how to interpret market signals without needing to be an active trader.
Overview
About Dividend Data
Dividend Data is a powerful financial data platform designed to bring institutional-grade stock market information directly into the tools you already use every day: Google Sheets and Microsoft Excel. It eliminates the tedious, error-prone process of manually copying and pasting data from financial websites. Instead, you get instant, live access to over 30 years of historical data for more than 80,000 tickers through simple, custom spreadsheet formulas. Built specifically by and for dividend and fundamental investors, it provides a comprehensive suite of data points including dividend amounts, yields, payout ratios, growth rates, complete financial statements, key valuation ratios, and real-time price history. The core value proposition is powerful simplicity: you get the deep data needed for serious investment analysis without needing API keys, coding skills, or a massive budget. With a generous free tier offering 2,500 monthly credits that never expire, it's built to empower every investor to make more informed, data-driven decisions right from their spreadsheet.
About Prediction Pulse
Prediction Pulse is your AI-powered intelligence hub for the world of prediction markets. It cuts through the noise by aggregating live odds from major platforms like Polymarket and Manifold, organizing thousands of markets into coherent real-world events, and then applying a proprietary AI analysis. This analysis, called the Pulse Score, estimates the most likely outcome for each market, highlights potential mispricings where the crowd might be wrong, and provides clear explanations for its reasoning. Whether you're looking to explore detailed event pages, compare probabilities across different platforms, or get AI-generated news on major market movements, Prediction Pulse delivers. It's designed for traders seeking an edge, researchers analyzing collective intelligence, and curious observers who simply want a clearer, data-driven window into what these markets are signaling about future events. In essence, it transforms fragmented betting data into actionable, understandable market intelligence.
Frequently Asked Questions
Dividend Data FAQ
How does the free tier work?
The free tier is remarkably generous and designed to be permanently useful. You receive 2,500 credits every month, which do not expire and refresh on a monthly cycle. Each data pull using a formula typically costs 1 credit. This allows for substantial usage, such as updating a portfolio of 50 stocks with several data points each month, completely free of charge and without any trial period pressure.
Do I need to know how to code or use APIs?
Absolutely not. Dividend Data requires zero coding knowledge or API integration. The entire system works through simple spreadsheet formulas that anyone familiar with basic Excel or Google Sheets functions can use. You just type the formula with the stock ticker, and the data appears instantly—no technical setup, key management, or complex configuration is needed.
What kind of data can I access?
You have access to a comprehensive suite of data critical for fundamental analysis. This includes dividend data (amounts, yields, dates, growth), real-time quotes and price history, complete financial statements (income, balance sheet, cash flow), and over 100 key financial ratios (valuation, profitability, liquidity). The database covers 80,000+ global tickers with 30+ years of history.
Is my data secure and private?
Yes. Dividend Data operates with a strong commitment to privacy. Your spreadsheet data and portfolio information are not stored on their servers. The add-in/plug-in facilitates a direct data pull into your sheet. You are in complete control of your data within your own spreadsheet file, which resides in your Google Drive or on your local computer.
Prediction Pulse FAQ
What is a Pulse Score?
The Pulse Score is Prediction Pulse's proprietary AI-generated probability for a given market outcome. It represents the platform's independent assessment of how likely an event is to happen, based on its analysis of available data. This score is compared against the current market price to highlight agreements, disagreements, and potential trading opportunities.
Which prediction market platforms does it aggregate?
Currently, Prediction Pulse aggregates live markets and odds from two major platforms: Polymarket and Manifold. The site states it tracks over 29,000 markets from these sources, providing a broad view of activity across these leading prediction market ecosystems.
How often is the data updated?
The market data and AI scores on Prediction Pulse are refreshed regularly. According to the platform, all information is updated every 15 minutes. This ensures that the odds, volumes, and Pulse Scores you see are relatively current and reflect recent market activity.
What does "Edge Opportunity" mean?
An "Edge Opportunity" is a market where Prediction Pulse's AI identifies a significant difference between its own Pulse Score probability and the current trading price on the prediction market. These are highlighted in sections like "Top Edge Movers" and suggest instances where the AI believes the collective market might be mispriced, presenting a potential edge for informed traders.
Alternatives
Dividend Data Alternatives
Dividend Data is a specialized tool that brings over 30 years of stock market data directly into your spreadsheets. It falls into the category of financial data providers, specifically designed for investors who focus on dividends and company fundamentals. Users often explore other options to find the best fit for their specific needs. People look for alternatives for various reasons. This could be due to budget constraints, a need for different features not offered, or because they primarily use a platform that isn't supported. Some may require more advanced analytical tools or a different data delivery method. When evaluating other services, consider what's most important for your workflow. Key factors include the depth and accuracy of historical data, the cost relative to your usage, compatibility with your preferred spreadsheet software, and how easily you can access the specific metrics you need without a technical hassle.
Prediction Pulse Alternatives
Prediction Pulse is an AI-powered intelligence platform in the business and finance category, specifically designed for prediction markets. It aggregates data from various market platforms, groups them into real-world events, and uses a proprietary AI engine to analyze probabilities and trends. Users often explore alternatives for several reasons. They might be looking for different pricing models, a platform that focuses on a specific niche or set of markets, or a tool with a different mix of features like more advanced charting or a different user interface. Some may prefer a platform that integrates with different data sources or offers a more hands-on analytical approach. When evaluating an alternative, consider what's most important for your needs. Key factors include the range of markets and platforms covered, the depth and clarity of the probability analysis provided, the quality of insights and explanations for market movements, and the overall user experience. The right tool should align with your goals, whether you're a serious trader, a researcher, or simply a curious observer of future trends.