Dividend Data vs Redbark
Side-by-side comparison to help you choose the right AI tool.
Dividend Data
Instantly pull stock dividends, prices, and financials directly into your Google Sheets or Excel spreadsheets.
Last updated: March 11, 2026
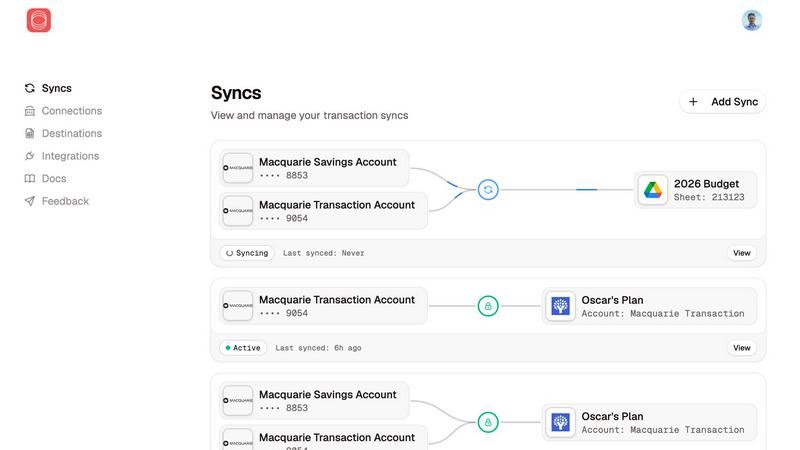
Sync your Australian bank and brokerage data automatically to apps like Google Sheets and YNAB.
Last updated: February 28, 2026
Visual Comparison
Dividend Data

Redbark
Feature Comparison
Dividend Data
Extensive Spreadsheet Functions
Dividend Data provides 16 custom, easy-to-use functions that cover every essential data point for fundamental analysis. Simply type formulas like =DIVIDENDDATA_DIVIDENDS("TICKER") or =DIVIDENDDATA_RATIOS("TICKER", "PeRatio") and the live data instantly populates your cell. These functions pull from a vast database, giving you one-click access to forward dividends, ex-dates, financial metrics, and real-time quotes, transforming your spreadsheet into a dynamic research terminal.
Decades of Historical Data
Access over 30 years of clean, reliable historical market data for a comprehensive long-term view. This deep historical context is crucial for analyzing dividend growth trends, assessing company performance through multiple economic cycles, and building robust financial models. Whether you're backtesting a strategy or calculating a 10-year dividend growth rate, you have the historical depth needed for thorough due diligence.
Cross-Platform Compatibility
The tool works seamlessly in both Google Sheets and Microsoft Excel environments. You can download it as an add-in from the Microsoft AppSource or install it as a Google Workspace add-on. This flexibility ensures teams and individual investors can use their preferred spreadsheet software without sacrificing functionality, making collaboration and data consistency easy across different platforms.
Built for Fundamental & Dividend Investors
Every feature is crafted with the needs of income and value investors in mind. The data focuses on dividend sustainability (payout ratios, growth rates), fundamental health (financial statements, earnings), and key valuation metrics. It cuts through the noise to deliver the specific data points—like next ex-dividend date or forward yield—that are most critical for building and managing a dividend-focused portfolio.
Redbark
Secure, Bank-Approved Data Access
Redbark uses Australia's regulated Consumer Data Right (CDR) framework to connect to your bank, not unreliable screen-scraping. This means your connection is secure, transparent, and officially sanctioned by your financial institution. You grant consent through your bank's own portal, and you can revoke it at any time, ensuring you have complete control over your data access with peace of mind.
Pass-Through Data Architecture for Maximum Privacy
Your financial data's journey is simple and secure: it flows directly from your bank to your chosen tool (like Google Sheets). Redbark acts as a secure conduit, never storing your transactions, balances, or account details on its servers. This pass-through model minimizes data exposure and aligns with best-practice privacy principles, keeping your sensitive information safe.
Multi-Destination and Smart Syncing
Sync your financial data to multiple tools at once. For example, send transactions to Google Sheets for custom analysis while simultaneously updating your balances in YNAB for budgeting. Redbark's intelligent deduplication uses ID-based matching with overlap buffers to catch late-posting transactions, ensuring you never have duplicate rows cluttering your spreadsheets.
Automated Background Syncs & Investment Tracking
Forget manual refreshes. When your bank receives a new transaction, it can push a notification (webhook) to Redbark, triggering an automatic background sync. This means your tools are updated in near real-time. Beyond everyday banking, Redbark also syncs your full investment portfolio holdings, live profit/loss figures, and trade history from supported global brokerages.
Use Cases
Dividend Data
Automated Dividend Portfolio Tracking
Manually updating a portfolio spreadsheet with current yields, dividend dates, and payment amounts is a chore. With Dividend Data, you can create a master watchlist or portfolio tracker where all these figures update automatically. Set formulas once for tickers like MSFT or KO, and your sheet will always display the latest forward dividend, yield, and next ex-date, saving hours of maintenance each month.
Screening and Comparative Analysis
Quickly screen and compare potential investments directly in your spreadsheet. Use the functions to pull key ratios like P/E, P/B, or debt-to-equity for a list of stocks side-by-side. Analyze dividend growth rates or payout ratios across sectors to identify the most financially stable and shareholder-friendly companies, all without ever leaving your familiar analytical environment.
Building Dynamic Financial Models
Create powerful, auto-updating discounted cash flow (DCF) models or dividend discount models (DDM). Link your model assumptions directly to live data feeds for revenue, EPS, and dividend per share. This ensures your valuation models are always based on the most recent reported figures, making your investment thesis and price targets more accurate and timely.
Educational Research and Backtesting
Ideal for students, bloggers, and investors honing their skills. Easily pull 10 years of dividend history to chart a company's growth trajectory or analyze how a stock's valuation multiples have changed over time. Test historical investment rules or strategies by building sheets that leverage decades of price and fundamental data for robust, evidence-based learning.
Redbark
Automated Business Bookkeeping for Freelancers & SMEs
Freelancers and small business owners can automate their bookkeeping by having all business account transactions flow directly into a Google Sheet. This creates a live, centralized ledger for tracking income, expenses, and cash flow without manual entry, saving hours each month and providing an always-up-to-date financial picture for making informed decisions.
Live Investment Portfolio Dashboard
Investors can build a comprehensive, auto-updating dashboard of their entire portfolio. By connecting brokerage accounts from platforms like CommSec and Stake, Redbark syncs holdings, live P&L, and trade history into a spreadsheet. This allows for real-time tracking of performance across different asset classes and accounts in one unified view.
Streamlined Personal Budgeting
Individuals can supercharge their budgeting in tools like YNAB or Actual Budget by automating transaction imports. Instead of manually entering or uploading statements, Redbark securely pushes new transactions from checking, savings, and credit card accounts directly into the budget app, ensuring categories are always accurate and up-to-date with minimal effort.
Centralized Financial Reporting and Analysis
Finance-savvy users, property investors, or households managing complex finances can centralize data from multiple banks and accounts into a single Notion database or Airtable base. This creates a powerful source for custom reporting, net worth tracking, and trend analysis, with data that refreshes automatically for reliable, hands-off reporting.
Overview
About Dividend Data
Dividend Data is a powerful financial data platform designed to bring institutional-grade stock market information directly into the tools you already use every day: Google Sheets and Microsoft Excel. It eliminates the tedious, error-prone process of manually copying and pasting data from financial websites. Instead, you get instant, live access to over 30 years of historical data for more than 80,000 tickers through simple, custom spreadsheet formulas. Built specifically by and for dividend and fundamental investors, it provides a comprehensive suite of data points including dividend amounts, yields, payout ratios, growth rates, complete financial statements, key valuation ratios, and real-time price history. The core value proposition is powerful simplicity: you get the deep data needed for serious investment analysis without needing API keys, coding skills, or a massive budget. With a generous free tier offering 2,500 monthly credits that never expire, it's built to empower every investor to make more informed, data-driven decisions right from their spreadsheet.
About Redbark
Redbark is your financial data's secure bridge, connecting your Australian bank accounts and global investment portfolios directly to the productivity tools you already know and love, like Google Sheets, Notion, and Airtable. It eliminates the tedious, error-prone chore of manual data entry and messy CSV file imports. Instead of outdated and risky screen-scraping methods, Redbark leverages Australia's official Consumer Data Right (CDR) framework, giving you bank-approved, secure access to your transaction, balance, and investment holding data. Your information syncs automatically on a schedule you control, flowing directly from your financial institution to your chosen destination without ever being stored on Redbark's servers. Built with simplicity and privacy at its core, it's the perfect solution for freelancers tracking invoices, investors monitoring portfolios, small business owners managing cash flow, and anyone who wants a clear, automated view of their finances in a familiar spreadsheet or dashboard. Set up takes just minutes with no coding required, supporting a wide range of Australian banks via CDR, New Zealand banks via Akahu, and global brokerages via SnapTrade.
Frequently Asked Questions
Dividend Data FAQ
How does the free tier work?
The free tier is remarkably generous and designed to be permanently useful. You receive 2,500 credits every month, which do not expire and refresh on a monthly cycle. Each data pull using a formula typically costs 1 credit. This allows for substantial usage, such as updating a portfolio of 50 stocks with several data points each month, completely free of charge and without any trial period pressure.
Do I need to know how to code or use APIs?
Absolutely not. Dividend Data requires zero coding knowledge or API integration. The entire system works through simple spreadsheet formulas that anyone familiar with basic Excel or Google Sheets functions can use. You just type the formula with the stock ticker, and the data appears instantly—no technical setup, key management, or complex configuration is needed.
What kind of data can I access?
You have access to a comprehensive suite of data critical for fundamental analysis. This includes dividend data (amounts, yields, dates, growth), real-time quotes and price history, complete financial statements (income, balance sheet, cash flow), and over 100 key financial ratios (valuation, profitability, liquidity). The database covers 80,000+ global tickers with 30+ years of history.
Is my data secure and private?
Yes. Dividend Data operates with a strong commitment to privacy. Your spreadsheet data and portfolio information are not stored on their servers. The add-in/plug-in facilitates a direct data pull into your sheet. You are in complete control of your data within your own spreadsheet file, which resides in your Google Drive or on your local computer.
Redbark FAQ
Is Redbark secure and how does it access my bank data?
Absolutely. Redbark uses Australia's official Consumer Data Right (CDR) framework, the regulated standard for secure data sharing. You connect your accounts through your bank's own secure portal, not by giving Redbark your login credentials. All data is encrypted in transit, and Redbark's pass-through architecture means your financial data is never stored on its servers.
Which banks and brokerages does Redbark support?
Redbark supports over 100 financial institutions. This includes all major Australian banks (like CommBank, Westpac, NAB, ANZ) via CDR Open Banking, New Zealand banks via our partner Akahu, and global brokerages and crypto exchanges (like Stake) via our integration with SnapTrade. You can view the full list of connections on our website.
Can I send my data to more than one tool?
Yes! A key feature of Redbark is multi-destination support. You can configure the same bank account to sync transactions to Google Sheets for your own analysis, while also sending balances to YNAB for budgeting, all simultaneously. Each destination can have its own custom formatting rules to suit your needs.
What happens to my data? Do you store it?
No, we do not store your sensitive financial data. Redbark uses a pass-through architecture. Your transaction and balance data flows directly from your bank or brokerage to your chosen destination (e.g., Sheets, Notion). We only store the necessary connection tokens (heavily encrypted) to maintain the sync, not your actual financial records.
Alternatives
Dividend Data Alternatives
Dividend Data is a specialized tool that brings over 30 years of stock market data directly into your spreadsheets. It falls into the category of financial data providers, specifically designed for investors who focus on dividends and company fundamentals. Users often explore other options to find the best fit for their specific needs. People look for alternatives for various reasons. This could be due to budget constraints, a need for different features not offered, or because they primarily use a platform that isn't supported. Some may require more advanced analytical tools or a different data delivery method. When evaluating other services, consider what's most important for your workflow. Key factors include the depth and accuracy of historical data, the cost relative to your usage, compatibility with your preferred spreadsheet software, and how easily you can access the specific metrics you need without a technical hassle.
Redbark Alternatives
Redbark is a financial data connector that securely syncs your Australian bank and global brokerage information directly into apps like Google Sheets, Notion, and Airtable. It falls into the category of personal and business finance automation tools, designed to save you from manual data entry. People often explore alternatives for various reasons. You might be looking for a different price point, need connections to financial institutions outside Redbark's current coverage, or prefer a tool with a built-in dashboard instead of sending data elsewhere. Your specific workflow and budget are key factors in the search. When evaluating other options, focus on security, compatibility, and automation. Look for how the tool accesses your data—bank-approved APIs are more secure and reliable than old-fashioned screen scraping. Check that it works with your specific banks and the apps where you need the data. Finally, consider if updates are automatic and on a schedule you control.