CMMC ROI vs Graph Maker
Side-by-side comparison to help you choose the right AI tool.

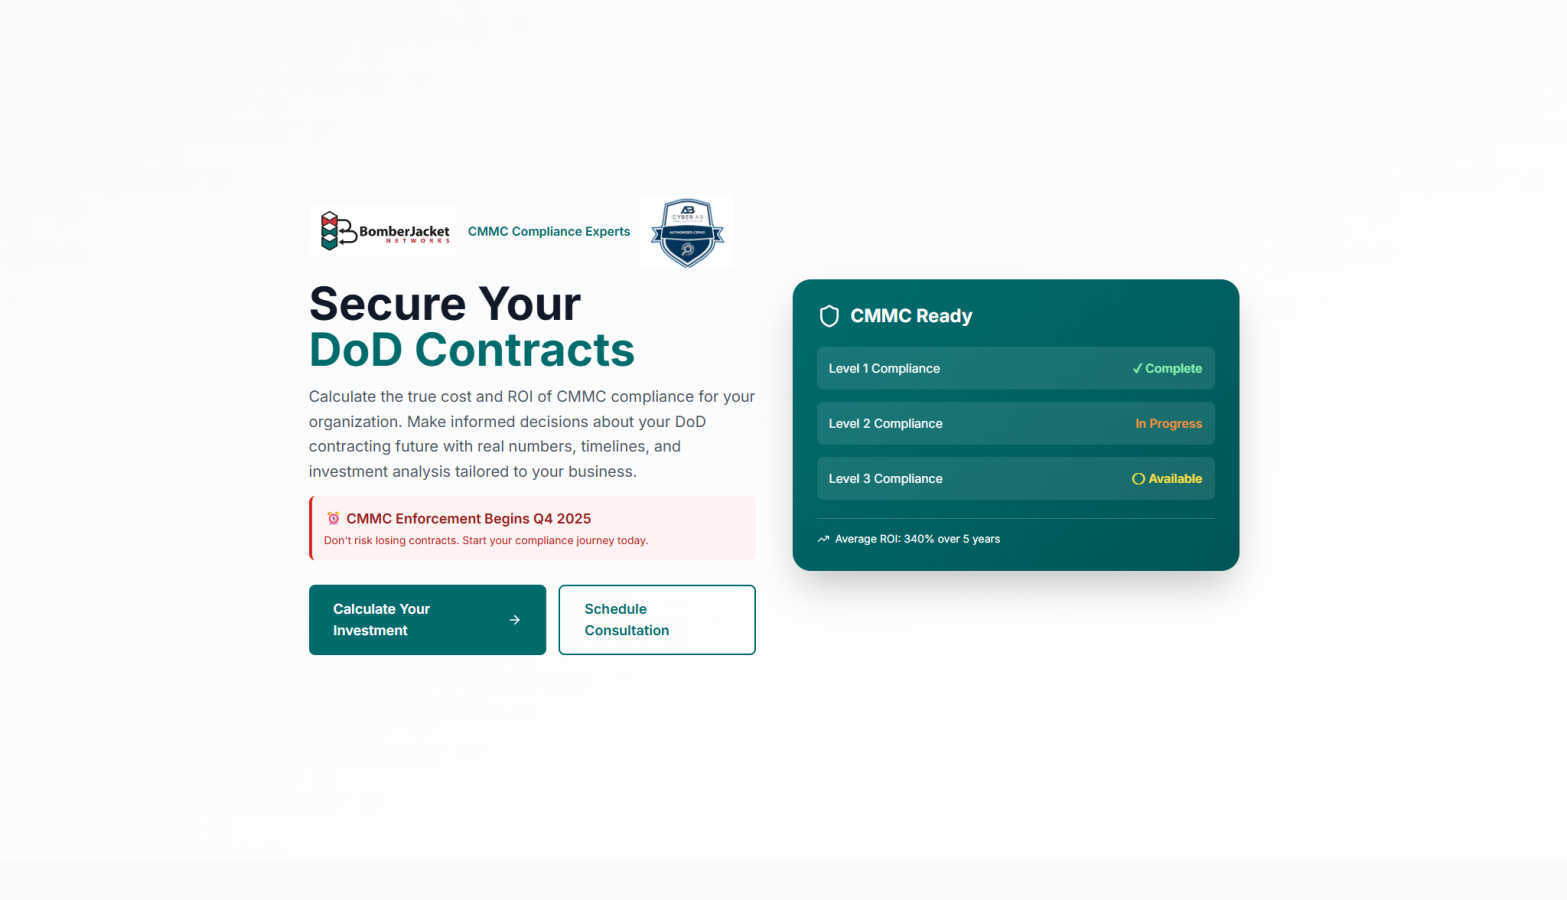
CMMC ROI
Calculate your CMMC compliance ROI with real cost data to secure DoD contracts.
Last updated: March 1, 2026
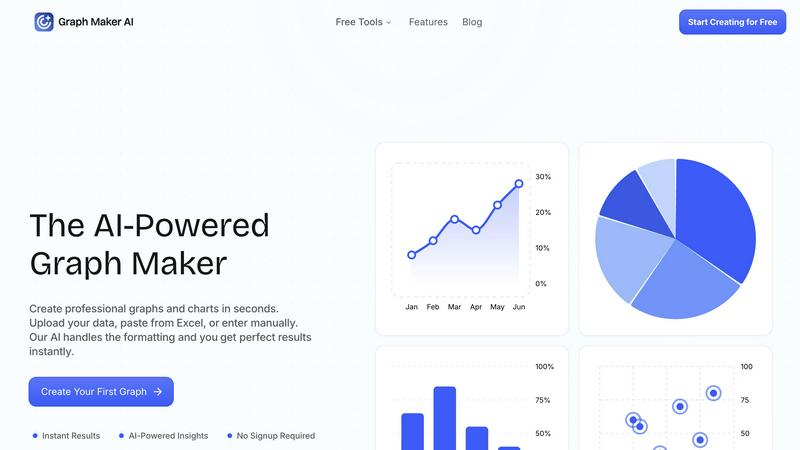
Graph Maker
Effortlessly create and customize stunning graphs and charts from your data in seconds with our AI-powered Graph Maker.
Last updated: February 26, 2026
Visual Comparison
CMMC ROI
Graph Maker
Feature Comparison
CMMC ROI
Personalized Investment Calculator
Go beyond generic estimates with a calculator tailored to your unique business. By inputting variables like your company size, annual DoD revenue, target CMMC level, and current compliance status, the tool generates a precise 5-year total investment range. It even allows you to edit cost fields for implementation, maintenance, and recertification to reflect your specific quotes or plans, delivering a truly customized financial model.
Detailed ROI & Break-Even Analysis
See exactly when your investment pays off. The tool doesn't just show costs; it calculates your potential 5-Year ROI percentage and pinpoints your payback period down to the month. A visual timeline projection chart illustrates your cumulative investment against your protected contract value, clearly showing the break-even point and the growing financial returns over time, making the business case crystal clear.
Risk Quantification & Contract Protection Metrics
Understand what's at stake in dollars and cents. The calculator quantifies your "Contract Value at Risk," showing the potential revenue loss without certification. It also factors in the average cost of avoiding a data breach or false claims act violation (estimated at $2.5M), translating abstract cybersecurity risks into tangible financial impacts that every executive can understand and act upon.
Strategic Implementation Timeline
Plan your journey with confidence. Beyond finances, CMMC ROI provides a realistic, month-by-month implementation roadmap to achieve certification. This timeline breaks down the key phases—Gap Assessment, Remediation, Documentation, Assessment Prep, and Certification—helping you allocate resources, set internal deadlines, and manage the entire project efficiently toward the goal of being audit-ready.
Graph Maker
Instant Graph Generation
With Graph Maker, simply paste your data and click "Generate." The AI-powered tool creates your graph in seconds, eliminating the need for time-consuming setup or configuration. This feature allows users to visualize data instantly without the hassle.
Fully Editable Graphs
Customize every aspect of your graphs, from themes and colors to labels and legends. This feature ensures that your visualizations can be tailored to meet specific presentation needs or personal preferences, making it easy to achieve the perfect look for your data.
Automatic AI Insights
Graph Maker doesn’t just create graphs; it also generates clear insights from your data. The AI analyzes trends, proportions, distributions, and correlations, helping you tell a meaningful story with your charts rather than just presenting numbers.
Multiple Graph Types
Choose from a variety of graph types, including line graphs, pie charts, bar graphs, and scatter plots. Each option is powered by AI, making it effortless to select the visualization that best fits your data and your goals.
Use Cases
CMMC ROI
Budget Justification for Leadership
Securing budget approval for CMMC compliance is a major hurdle. Finance and executive teams need hard numbers. Use CMMC ROI to generate a compelling executive briefing that clearly outlines the required investment, the projected ROI, the cost of inaction, and a realistic timeline. This turns a security request into a strategic business investment proposal with a demonstrable financial return.
Strategic Planning for Small Subcontractors
Small businesses with limited resources need to know if pursuing DoD contracts is financially viable. By inputting their modest DoD revenue and size, they can see a realistic investment range for Level 1 or 2 compliance. This helps them decide whether to pursue the market, seek assistance, or understand the minimum contract value needed to make the endeavor profitable.
Proposal Development and Bid Pricing
Prime contractors and larger firms bidding on new contracts must factor compliance costs into their proposals. The calculator helps accurately estimate the ongoing cost of maintaining the required CMMC level, ensuring these expenses are properly accounted for in bid pricing to protect profit margins while remaining competitive.
Progress Assessment and Course Correction
For companies already on their compliance journey, the tool is invaluable for tracking financial progress. By updating the "Current Compliance Status" to "In Progress" or "Nearly Complete," you can see how your remaining costs decrease and how your ROI improves, validating your spending to date and helping prioritize remaining budget for the final push to certification.
Graph Maker
Students and Educators
Students can leverage Graph Maker for homework, science projects, and presentations, while educators can create engaging graphs for lessons and classroom materials. The tool's simplicity allows users to focus on learning rather than struggling with complex software.
Marketers and Content Creators
Marketing teams utilize Graph Maker to visualize campaign data, create social media graphics, and generate client reports. By turning spreadsheets into shareable visuals quickly, they enhance their storytelling and communication efforts.
Business Analysts and Data Professionals
Data professionals can streamline their workflow by using Graph Maker to replace tedious Excel tasks. The tool allows for quick visualizations, enabling analysts to focus on extracting insights rather than formatting data.
Researchers and Scientists
Researchers can use Graph Maker to visualize their findings in a professional manner. Whether presenting statistical analysis or displaying experimental data, the tool makes it easy to create compelling graphs that enhance the impact of their research.
Overview
About CMMC ROI
CMMC ROI is your essential financial planning partner for navigating the Cybersecurity Maturity Model Certification (CMMC) landscape. Designed specifically for Department of Defense (DoD) contractors, this powerful tool transforms the complex, often intimidating process of CMMC compliance into a clear, data-driven business strategy. With the enforcement deadline beginning in Q4 2025, the pressure is on for businesses of all sizes—from small subcontractors to large prime contractors—to understand the investment required to secure their future DoD contracts. CMMC ROI cuts through the uncertainty by providing personalized, realistic cost projections and a detailed return-on-investment (ROI) analysis. By inputting your company's specific details like size, DoD revenue, and target CMMC level, you'll receive a comprehensive 5-year financial outlook. This includes your total investment range, your break-even point, and a stark quantification of the immense risk of non-compliance. The core value is moving from fear and guesswork to confidence and clarity, empowering you to make informed budgetary decisions, avoid costly security breaches, and gain a decisive competitive edge with a strategy backed by real numbers.
About Graph Maker
Graph Maker is an innovative AI-powered tool that revolutionizes the way you create professional graphs and charts. Designed for users of all backgrounds—from students and educators to marketers and business analysts—Graph Maker simplifies the data visualization process. You can easily upload your data, paste it from Excel, or input it manually, and the tool's advanced AI takes care of the formatting and design aspects, delivering perfect results in seconds. The primary value proposition of Graph Maker is its ability to save you time and effort; with no signup required, you can start creating visually appealing graphs immediately. Whether you need to illustrate trends, compare data, or present insights, Graph Maker provides an accessible solution that turns your raw data into clear, engaging visuals in no time.
Frequently Asked Questions
CMMC ROI FAQ
How accurate are the cost estimates provided?
The estimates are based on aggregated industry data and real-world implementation scenarios for companies of similar size and complexity. They provide a highly reliable range to start your planning. For the most precise figures, you can input actual quotes from CMMC consultants or your internal IT team into the editable cost fields to create a fully customized model.
What is included in the "Protected Value" for the ROI calculation?
The Protected Value is a conservative estimate of the financial benefit of certification. It combines your projected 5-year DoD contract revenue (which is at risk without CMMC) with an average cost avoidance of $2.5M for preventing a potential data breach or related legal penalties. This holistic view captures both revenue protection and risk mitigation.
My company is already working on compliance. Can the tool account for this?
Absolutely! The calculator includes a "Current Compliance Status" selector. Choosing "In Progress" applies a 30% discount to the implementation cost estimate, and "Nearly Complete" applies a 60% discount. This reflects money already spent and provides a realistic view of the remaining investment needed to reach full certification.
Why is the payback period often less than a year?
The payback period is frequently short because the primary "return" is the protection of existing and future DoD contract revenue that would be lost without certification. When this large, at-risk contract value is secured, it often offsets the initial implementation investment very quickly, especially for firms with significant DoD revenue streams.
Graph Maker FAQ
How does Graph Maker handle data formatting?
Graph Maker's AI automatically cleans and formats your data upon input. This means you can spend less time on data preparation and more time on analyzing and understanding your results.
Do I need to create an account to use Graph Maker?
No, there is no signup required to use Graph Maker. You can start creating your graphs immediately, making it a hassle-free experience for all users.
Can I customize the graphs I create?
Absolutely! Graph Maker allows you to customize various elements of your graphs, including themes, labels, and legends, ensuring that your visualizations meet your specific needs.
What types of graphs can I create with Graph Maker?
Graph Maker offers a wide range of graph types, including line graphs, pie charts, bar graphs, and scatter plots. You can choose the type that best represents your data and insights.
Alternatives
CMMC ROI Alternatives
CMMC ROI is a specialized business intelligence tool designed to help DoD contractors calculate the financial impact of CMMC compliance. It provides personalized cost projections and ROI analysis to turn a complex security requirement into a clear strategic investment. Users often explore alternatives for various reasons. Some may need a tool that integrates with their existing project management platform, while others might be looking for different pricing models or a solution that offers more hands-on consulting services alongside the calculations. When evaluating other options, focus on finding a tool that offers accurate, data-driven cost modeling specific to the Defense Industrial Base. Look for clarity in the financial breakdown, a realistic timeline projection, and the ability to customize inputs to match your company's unique profile. The goal is to move from uncertainty to a actionable, justified budget.
Graph Maker Alternatives
Graph Maker is an innovative AI-powered tool that enables users to create professional graphs and charts in just seconds. It falls under the categories of AI Assistants, Analytics & Data, Business Intelligence, and Data Visualization. Users often seek alternatives to Graph Maker due to various reasons such as pricing, specific feature requirements, or compatibility with different platforms. Selecting the right alternative involves considering aspects like user-friendliness, customization options, data handling capabilities, and overall performance to ensure that it meets your unique graphing needs. When exploring alternatives, it's essential to evaluate how well the tool integrates with your existing workflows and whether it can handle the types of data you typically work with. Additionally, consider the level of support and resources available for users, as well as any trial periods that allow you to test the software before committing. This way, you can find a solution that best fits your requirements and enhances your data visualization experience.