DingTouAPP vs Dividend Data
Side-by-side comparison to help you choose the right AI tool.
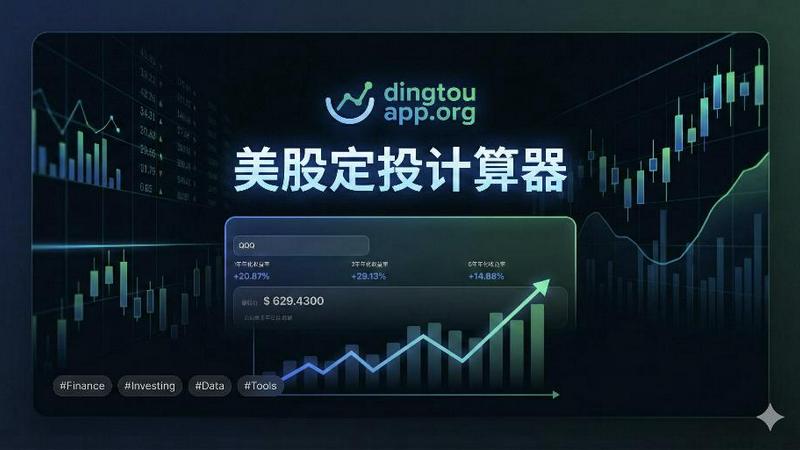
DingTouAPP
DingTouAPP is a free tool for backtesting Dollar-Cost Averaging and calculating compound interest for U.S. and A-shares.
Last updated: February 26, 2026
Dividend Data
Instantly pull stock dividends, prices, and financials directly into your Google Sheets or Excel spreadsheets.
Last updated: March 11, 2026
Visual Comparison
DingTouAPP
Dividend Data

Feature Comparison
DingTouAPP
Powerful Backtesting Engine
The core of DingTouAPP is its advanced backtesting engine, which allows users to simulate their investment strategies over the past five years. By inputting stock symbols and customizing investment parameters, investors can visualize potential outcomes, making it easier to refine their DCA strategies.
Customizable Investment Parameters
Users can set their initial investment, periodic investment amounts, and the frequency of contributions, whether weekly, monthly, or at other intervals. This level of customization enables investors to tailor their approach to suit their financial goals and risk tolerance.
Comprehensive Historical Data
DingTouAPP automatically fetches up to five years of daily historical data for the selected stocks or ETFs. This data is crucial for accurate calculations of investment returns, offering insights into how different market conditions could affect investment performance over time.
Detailed Investment Tracking
The app provides detailed tracking of each investment, including purchase prices, cumulative costs, and floating profits. Users can view the outcomes of their DCA strategy through a clear dashboard, which helps in making data-driven decisions to optimize future investments.
Dividend Data
Extensive Spreadsheet Functions
Dividend Data provides 16 custom, easy-to-use functions that cover every essential data point for fundamental analysis. Simply type formulas like =DIVIDENDDATA_DIVIDENDS("TICKER") or =DIVIDENDDATA_RATIOS("TICKER", "PeRatio") and the live data instantly populates your cell. These functions pull from a vast database, giving you one-click access to forward dividends, ex-dates, financial metrics, and real-time quotes, transforming your spreadsheet into a dynamic research terminal.
Decades of Historical Data
Access over 30 years of clean, reliable historical market data for a comprehensive long-term view. This deep historical context is crucial for analyzing dividend growth trends, assessing company performance through multiple economic cycles, and building robust financial models. Whether you're backtesting a strategy or calculating a 10-year dividend growth rate, you have the historical depth needed for thorough due diligence.
Cross-Platform Compatibility
The tool works seamlessly in both Google Sheets and Microsoft Excel environments. You can download it as an add-in from the Microsoft AppSource or install it as a Google Workspace add-on. This flexibility ensures teams and individual investors can use their preferred spreadsheet software without sacrificing functionality, making collaboration and data consistency easy across different platforms.
Built for Fundamental & Dividend Investors
Every feature is crafted with the needs of income and value investors in mind. The data focuses on dividend sustainability (payout ratios, growth rates), fundamental health (financial statements, earnings), and key valuation metrics. It cuts through the noise to deliver the specific data points—like next ex-dividend date or forward yield—that are most critical for building and managing a dividend-focused portfolio.
Use Cases
DingTouAPP
Individual Investor Strategy Optimization
Individual investors can use DingTouAPP to refine their DCA strategies by analyzing historical performance. This helps them understand how their investments would have fared under various market conditions, allowing for better decision-making moving forward.
Financial Advisors Assisting Clients
Financial advisors can leverage DingTouAPP to provide clients with data-backed insights into potential investment strategies. By demonstrating how various DCA approaches could perform, advisors can enhance their clients' investment plans and build trust through transparency.
Educational Tool for New Investors
New investors can use DingTouAPP as an educational resource to learn about dollar-cost averaging and investment strategies. The app's user-friendly interface and detailed results help demystify investing, making it accessible for those unfamiliar with the stock market.
Performance Comparison of Different Assets
Investors looking to compare the performance of different stocks or ETFs can utilize DingTouAPP to simulate various scenarios. By examining the outcomes of different investment options, users can make informed choices that align with their financial objectives and risk profiles.
Dividend Data
Automated Dividend Portfolio Tracking
Manually updating a portfolio spreadsheet with current yields, dividend dates, and payment amounts is a chore. With Dividend Data, you can create a master watchlist or portfolio tracker where all these figures update automatically. Set formulas once for tickers like MSFT or KO, and your sheet will always display the latest forward dividend, yield, and next ex-date, saving hours of maintenance each month.
Screening and Comparative Analysis
Quickly screen and compare potential investments directly in your spreadsheet. Use the functions to pull key ratios like P/E, P/B, or debt-to-equity for a list of stocks side-by-side. Analyze dividend growth rates or payout ratios across sectors to identify the most financially stable and shareholder-friendly companies, all without ever leaving your familiar analytical environment.
Building Dynamic Financial Models
Create powerful, auto-updating discounted cash flow (DCF) models or dividend discount models (DDM). Link your model assumptions directly to live data feeds for revenue, EPS, and dividend per share. This ensures your valuation models are always based on the most recent reported figures, making your investment thesis and price targets more accurate and timely.
Educational Research and Backtesting
Ideal for students, bloggers, and investors honing their skills. Easily pull 10 years of dividend history to chart a company's growth trajectory or analyze how a stock's valuation multiples have changed over time. Test historical investment rules or strategies by building sheets that leverage decades of price and fundamental data for robust, evidence-based learning.
Overview
About DingTouAPP
DingTouAPP is a sophisticated investment tool designed specifically for investors looking to optimize their dollar-cost averaging (DCA) strategies in the US stock and ETF markets. With its powerful backtesting engine, users can easily simulate and analyze their investment strategies by inputting popular stock symbols, such as SPY, QQQ, or AAPL. The app allows for extensive customization of investment parameters, including initial investment amounts, periodic contributions, and investment intervals, making it suitable for both novice and experienced investors. By leveraging up to five years of historical data, DingTouAPP provides precise calculations of purchase prices, cumulative costs, and floating profits. This feature empowers users to make informed decisions based on historical performance, enhancing their investing confidence and strategy effectiveness.
About Dividend Data
Dividend Data is a powerful financial data platform designed to bring institutional-grade stock market information directly into the tools you already use every day: Google Sheets and Microsoft Excel. It eliminates the tedious, error-prone process of manually copying and pasting data from financial websites. Instead, you get instant, live access to over 30 years of historical data for more than 80,000 tickers through simple, custom spreadsheet formulas. Built specifically by and for dividend and fundamental investors, it provides a comprehensive suite of data points including dividend amounts, yields, payout ratios, growth rates, complete financial statements, key valuation ratios, and real-time price history. The core value proposition is powerful simplicity: you get the deep data needed for serious investment analysis without needing API keys, coding skills, or a massive budget. With a generous free tier offering 2,500 monthly credits that never expire, it's built to empower every investor to make more informed, data-driven decisions right from their spreadsheet.
Frequently Asked Questions
DingTouAPP FAQ
What is the purpose of DingTouAPP?
DingTouAPP is designed to help investors simulate and analyze their dollar-cost averaging strategies in the US stock and ETF markets. It provides valuable insights based on historical data to inform investment decisions.
How does the backtesting engine work?
The backtesting engine allows users to input stock symbols and customize their investment parameters. It then simulates the investment over the past five years, fetching historical data to calculate potential outcomes based on user-defined strategies.
Can I use DingTouAPP for assets other than US stocks?
While DingTouAPP primarily focuses on US stocks and ETFs, its methodology can be adapted for various investment strategies. However, users should verify the availability of historical data for other asset classes.
Is there a limit to the number of stocks I can analyze?
DingTouAPP allows users to input multiple stock symbols for analysis, but the primary focus is on individual strategies. Users can compare and analyze different stocks but should ensure they are within the app's operational limits for optimal performance.
Dividend Data FAQ
How does the free tier work?
The free tier is remarkably generous and designed to be permanently useful. You receive 2,500 credits every month, which do not expire and refresh on a monthly cycle. Each data pull using a formula typically costs 1 credit. This allows for substantial usage, such as updating a portfolio of 50 stocks with several data points each month, completely free of charge and without any trial period pressure.
Do I need to know how to code or use APIs?
Absolutely not. Dividend Data requires zero coding knowledge or API integration. The entire system works through simple spreadsheet formulas that anyone familiar with basic Excel or Google Sheets functions can use. You just type the formula with the stock ticker, and the data appears instantly—no technical setup, key management, or complex configuration is needed.
What kind of data can I access?
You have access to a comprehensive suite of data critical for fundamental analysis. This includes dividend data (amounts, yields, dates, growth), real-time quotes and price history, complete financial statements (income, balance sheet, cash flow), and over 100 key financial ratios (valuation, profitability, liquidity). The database covers 80,000+ global tickers with 30+ years of history.
Is my data secure and private?
Yes. Dividend Data operates with a strong commitment to privacy. Your spreadsheet data and portfolio information are not stored on their servers. The add-in/plug-in facilitates a direct data pull into your sheet. You are in complete control of your data within your own spreadsheet file, which resides in your Google Drive or on your local computer.
Alternatives
DingTouAPP Alternatives
DingTouAPP is a free online tool designed for users interested in Dollar-Cost Averaging (DCA) backtesting and compound interest calculation. It falls under the Business & Finance category, catering to investors who want to simulate investment strategies using historical data of US stocks and ETFs. Users often seek alternatives to DingTouAPP for various reasons, such as the need for additional features, different pricing models, or specific platform compatibility. When searching for alternatives, it's essential to consider aspects like user interface, ease of use, available investment options, and the ability to customize strategies. These factors can greatly influence the overall experience and effectiveness of the chosen tool.
Dividend Data Alternatives
Dividend Data is a specialized tool that brings over 30 years of stock market data directly into your spreadsheets. It falls into the category of financial data providers, specifically designed for investors who focus on dividends and company fundamentals. Users often explore other options to find the best fit for their specific needs. People look for alternatives for various reasons. This could be due to budget constraints, a need for different features not offered, or because they primarily use a platform that isn't supported. Some may require more advanced analytical tools or a different data delivery method. When evaluating other services, consider what's most important for your workflow. Key factors include the depth and accuracy of historical data, the cost relative to your usage, compatibility with your preferred spreadsheet software, and how easily you can access the specific metrics you need without a technical hassle.