finban vs Graph Maker
Side-by-side comparison to help you choose the right AI tool.
Finban simplifies liquidity planning, helping you make confident decisions on hiring, taxes, and investments without.
Last updated: February 26, 2026
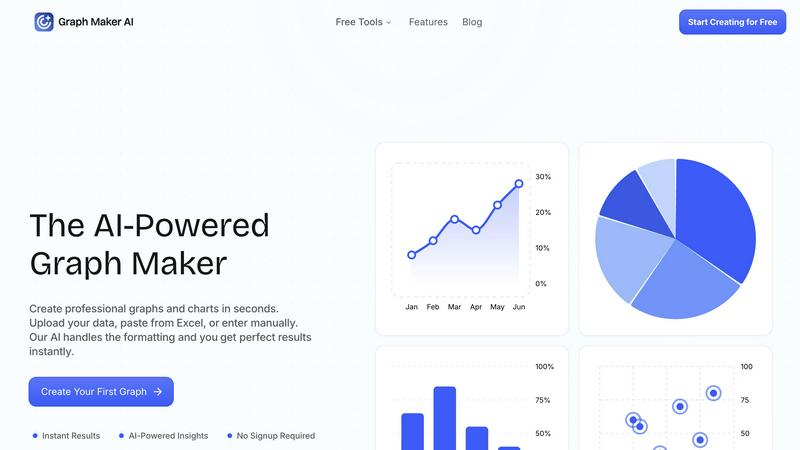
Graph Maker
Effortlessly create and customize stunning graphs and charts from your data in seconds with our AI-powered Graph Maker.
Last updated: February 26, 2026
Visual Comparison
finban

Graph Maker
Feature Comparison
finban
Liquidity OS
Liquidity OS is finban's core feature, enabling users to monitor their cash flow on a daily basis. This tool provides insights into incoming and outgoing cash, allowing businesses to assess how long their funds will last. With this feature, companies can ensure they are prepared for any financial scenario, minimizing the risks associated with cash flow uncertainty.
Scenario Simulation
The scenario simulation feature allows users to explore various financial options by asking, "What happens if…?" Instead of relying on gut feelings, finban enables users to visualize the impact of different decisions on liquidity. This insight supports more informed decision-making, helping businesses plan for potential outcomes with confidence.
Real-time Budgets
Managing budgets can be challenging, especially when reality diverges from initial plans. finban addresses this issue by integrating planning with actual financial data, highlighting any discrepancies immediately. This ensures that businesses can adapt their budgets in real-time, maintaining alignment with financial realities.
Smart Forecasts
Traditional forecasting methods can be outdated or overly complex. finban simplifies this process by keeping forecasts current and easy to maintain. The platform uses data-driven insights to provide accurate financial predictions, which can be adjusted quickly as circumstances change, allowing businesses to stay agile in their planning.
Graph Maker
Instant Graph Generation
With Graph Maker, simply paste your data and click "Generate." The AI-powered tool creates your graph in seconds, eliminating the need for time-consuming setup or configuration. This feature allows users to visualize data instantly without the hassle.
Fully Editable Graphs
Customize every aspect of your graphs, from themes and colors to labels and legends. This feature ensures that your visualizations can be tailored to meet specific presentation needs or personal preferences, making it easy to achieve the perfect look for your data.
Automatic AI Insights
Graph Maker doesn’t just create graphs; it also generates clear insights from your data. The AI analyzes trends, proportions, distributions, and correlations, helping you tell a meaningful story with your charts rather than just presenting numbers.
Multiple Graph Types
Choose from a variety of graph types, including line graphs, pie charts, bar graphs, and scatter plots. Each option is powered by AI, making it effortless to select the visualization that best fits your data and your goals.
Use Cases
finban
Financial Decision-Making
Businesses can use finban to facilitate better financial decision-making. By providing clear visibility into cash flow and financial projections, companies can make informed choices about hiring, investments, and project funding, ultimately driving growth and success.
Budget Management
finban is invaluable for managing budgets effectively. Its integration of actual financial data with planned budgets allows users to identify variances quickly. This helps businesses adjust their spending in real-time, ensuring that they remain on track with their financial goals.
Scenario Planning
With the scenario simulation feature, businesses can plan for the future by testing various financial scenarios. This capability allows organizations to understand the potential impacts of different decisions, from launching new products to adjusting pricing strategies, promoting proactive management.
Consolidated Financial Overview
For businesses with multiple entities or accounts, finban offers a consolidated view of finances. Users can see cash flow, forecasts, and trends across all their organizations in one place. This comprehensive overview simplifies financial management, making it easier to strategize across the business landscape.
Graph Maker
Students and Educators
Students can leverage Graph Maker for homework, science projects, and presentations, while educators can create engaging graphs for lessons and classroom materials. The tool's simplicity allows users to focus on learning rather than struggling with complex software.
Marketers and Content Creators
Marketing teams utilize Graph Maker to visualize campaign data, create social media graphics, and generate client reports. By turning spreadsheets into shareable visuals quickly, they enhance their storytelling and communication efforts.
Business Analysts and Data Professionals
Data professionals can streamline their workflow by using Graph Maker to replace tedious Excel tasks. The tool allows for quick visualizations, enabling analysts to focus on extracting insights rather than formatting data.
Researchers and Scientists
Researchers can use Graph Maker to visualize their findings in a professional manner. Whether presenting statistical analysis or displaying experimental data, the tool makes it easy to create compelling graphs that enhance the impact of their research.
Overview
About finban
finban is an innovative liquidity planning tool designed to empower businesses by providing them with a detailed, real-time overview of their financial health. Acting as a "CFO in your pocket," finban helps users plan their liquidity effectively, enabling confident decision-making regarding hiring, taxes, projects, and investments. This user-friendly platform eliminates the chaos often associated with traditional financial planning tools like Excel, allowing businesses to quickly get started and maintain clarity in their financial operations. finban is ideal for entrepreneurs, finance professionals, and small to medium-sized businesses seeking a comprehensive solution for managing cash flow and financial forecasting. With its intuitive interface and powerful features, finban ensures that users can easily simulate scenarios, track budgets, and consolidate financial data from multiple sources, all while reducing the time spent on manual data entry.
About Graph Maker
Graph Maker is an innovative AI-powered tool that revolutionizes the way you create professional graphs and charts. Designed for users of all backgrounds—from students and educators to marketers and business analysts—Graph Maker simplifies the data visualization process. You can easily upload your data, paste it from Excel, or input it manually, and the tool's advanced AI takes care of the formatting and design aspects, delivering perfect results in seconds. The primary value proposition of Graph Maker is its ability to save you time and effort; with no signup required, you can start creating visually appealing graphs immediately. Whether you need to illustrate trends, compare data, or present insights, Graph Maker provides an accessible solution that turns your raw data into clear, engaging visuals in no time.
Frequently Asked Questions
finban FAQ
What types of businesses can benefit from finban?
finban is designed for small to medium-sized enterprises, entrepreneurs, and finance professionals looking to streamline their liquidity planning and cash flow management. It is suitable for various industries and sectors.
How does finban ensure data accuracy?
finban integrates data from multiple sources, such as banking and accounting software, to provide a unified view of finances. This minimizes manual data entry and errors, ensuring that users have accurate and up-to-date financial information.
Is there a trial period for finban?
Yes, finban offers a 14-day free trial, allowing users to explore the platform's features and capabilities without any commitment. This trial period helps businesses assess how finban can meet their financial planning needs.
Can I integrate other tools with finban?
Absolutely! finban allows for seamless integration with various tools, including accounting software and payment platforms. This connectivity helps centralize data, enhancing visibility and decision-making across financial operations.
Graph Maker FAQ
How does Graph Maker handle data formatting?
Graph Maker's AI automatically cleans and formats your data upon input. This means you can spend less time on data preparation and more time on analyzing and understanding your results.
Do I need to create an account to use Graph Maker?
No, there is no signup required to use Graph Maker. You can start creating your graphs immediately, making it a hassle-free experience for all users.
Can I customize the graphs I create?
Absolutely! Graph Maker allows you to customize various elements of your graphs, including themes, labels, and legends, ensuring that your visualizations meet your specific needs.
What types of graphs can I create with Graph Maker?
Graph Maker offers a wide range of graph types, including line graphs, pie charts, bar graphs, and scatter plots. You can choose the type that best represents your data and insights.
Alternatives
finban Alternatives
finban is a financial planning tool designed to help businesses manage their liquidity effectively. It falls under the category of Business Intelligence, offering users a seamless way to make informed decisions regarding hiring, taxes, projects, and investments. Many individuals and businesses seek alternatives to finban for various reasons, including pricing concerns, specific feature needs, or the desire for integration with existing platforms. As businesses grow and evolve, their financial management needs may change, prompting a search for solutions that better align with their current requirements. When looking for an alternative to finban, it's essential to consider several factors. First, evaluate the pricing structure to ensure it fits within your budget. Next, assess the features offered to determine if they meet your specific business needs, such as ease of use, reporting capabilities, and customer support. Finally, consider compatibility with your existing systems and platforms to ensure a smooth transition and integration.
Graph Maker Alternatives
Graph Maker is an innovative AI-powered tool that enables users to create professional graphs and charts in just seconds. It falls under the categories of AI Assistants, Analytics & Data, Business Intelligence, and Data Visualization. Users often seek alternatives to Graph Maker due to various reasons such as pricing, specific feature requirements, or compatibility with different platforms. Selecting the right alternative involves considering aspects like user-friendliness, customization options, data handling capabilities, and overall performance to ensure that it meets your unique graphing needs. When exploring alternatives, it's essential to evaluate how well the tool integrates with your existing workflows and whether it can handle the types of data you typically work with. Additionally, consider the level of support and resources available for users, as well as any trial periods that allow you to test the software before committing. This way, you can find a solution that best fits your requirements and enhances your data visualization experience.