MarketWrk vs StatPecker
Side-by-side comparison to help you choose the right AI tool.
MarketWrk
Automates CPG pricing, MAP, & review monitoring.

StatPecker gives you fast, private AI insights and stunning visuals from your data.
Last updated: March 1, 2026
Visual Comparison
MarketWrk
StatPecker
Overview
About MarketWrk
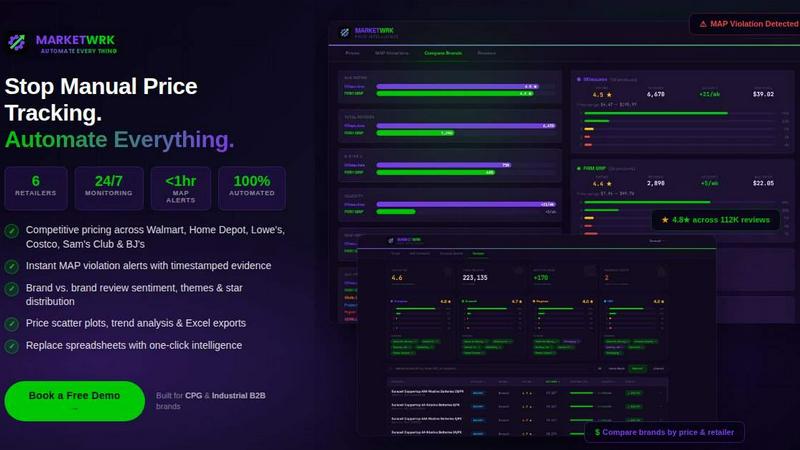
MARKETWRK is a brand management platform built for CPG and industrial B2B brands. It automates competitive pricing, MAP violation detection, ratings and review monitoring, and brand comparison across major retailers including Walmart, Home Depot, Lowe's, Costco, Sam's Club, BJ's, and Ace Hardware.
Brands use MARKETWRK to track competitor prices by zip code, catch MAP violations the day they happen, monitor customer review sentiment with AI-extracted themes, and benchmark their products against the competition — all from a single dark-mode portal with interactive charts, Excel exports, and automated email alerts.
Unlike enterprise tools that cost $50K+/year and take months to implement, MARKETWRK delivers the same data at a fraction of the cost with setup in days, not quarters. Current clients include Duracell and other national brands tracking hundreds of products across multiple retailers.
About StatPecker
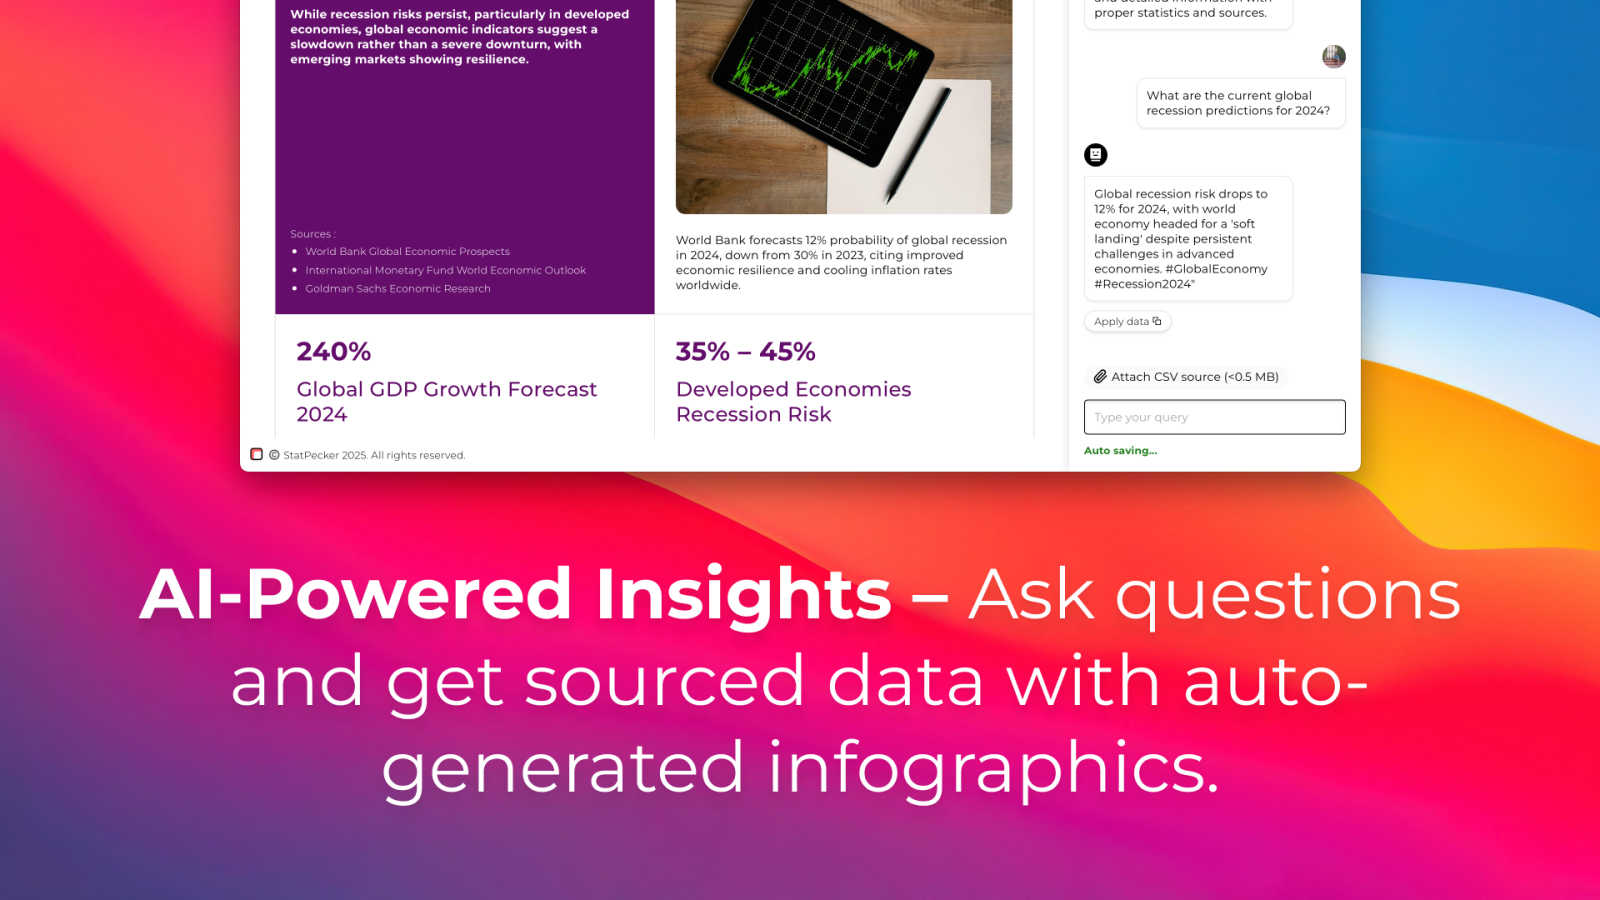
StatPecker is your friendly AI-powered sidekick for transforming boring numbers into beautiful, insightful stories. At its heart, it's a smart data visualization tool that takes raw data—whether from online sources or your own CSV files—and turns it into engaging infographics, charts, and reports in seconds. It's built for anyone who needs to communicate data clearly and compellingly, without needing a degree in design or data science. Think of content creators looking to spice up their blog posts, marketers needing to showcase campaign results, educators simplifying complex topics for students, or business analysts who want to share insights quickly with their team. The core value of StatPecker is its simplicity and power: you ask a question or upload your data, and it handles the heavy lifting of analysis and design, saving you hours of manual work in tools like spreadsheets or graphic editors. It’s about making data storytelling accessible, fast, and impactful for everyone.