Opal44 vs StatPecker
Side-by-side comparison to help you choose the right AI tool.
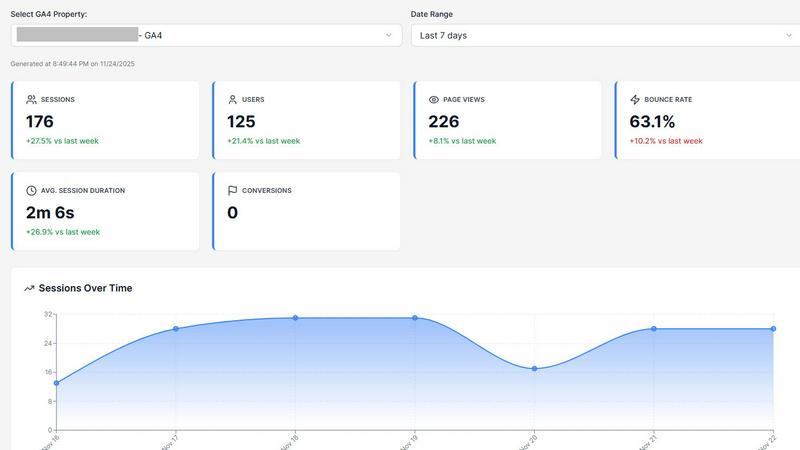
Opal44 explains your website traffic in plain English using AI, so you can make smarter decisions.
Last updated: March 4, 2026

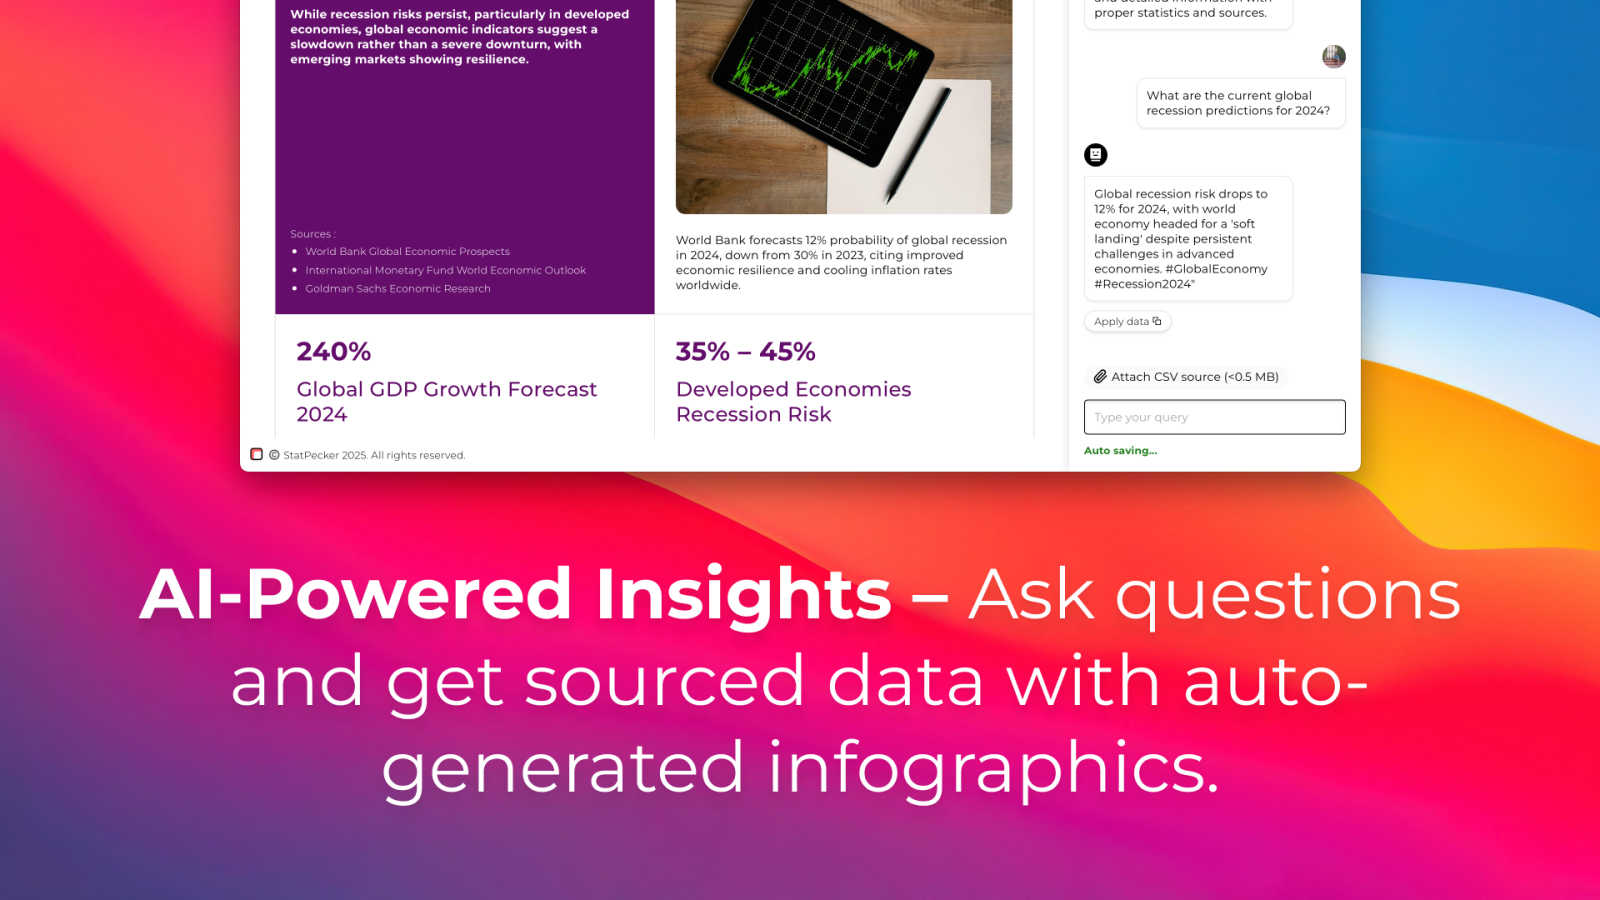
StatPecker gives you fast, private AI insights and stunning visuals from your data.
Last updated: March 1, 2026
Visual Comparison
Opal44
StatPecker
Feature Comparison
Opal44
Plain English Insights
This is the heart of Opal44. The AI analyzes your connected GA4 data and explains trends, spikes, drops, and user behavior in simple, everyday language you can actually understand. Instead of seeing "Sessions: 5,432," you'll get an insight like, "Your traffic from social media increased by 20% this week, driven mainly by your latest LinkedIn post." It removes the guesswork and technical barrier, making analytics accessible to everyone on your team.
Conversation-Style Reports
Forget dry, static PDFs. Opal44 delivers updates and reports that read like a natural conversation. Imagine getting a summary that says, "Hey, I noticed your blog traffic dipped on Tuesday. It looks like the drop came from organic search, possibly because a key page lost some ranking. Here's a link to that page and a tip on how to improve its content." This approach makes digesting information faster and more engaging.
Smart, Data-Driven Tips
Opal44 doesn't just tell you what happened; it suggests what to do next. Based on your specific data, the AI provides tailored recommendations to help you improve. For example, it might say, "Your product page has a high bounce rate. Consider adding a video demo or more customer testimonials to keep visitors engaged," giving you a clear, actionable next step backed by your own numbers.
Real-Time Alerts
Stay informed instantly about critical changes in your website traffic. Opal44 monitors your GA4 data and sends you alerts for significant events, like an unexpected traffic spike, a sudden drop in conversions, or unusual user activity. This allows you to react quickly to opportunities or address potential issues before they impact your business, all without needing to constantly check your analytics dashboard.
StatPecker
Ask Your Query
Simply type a question in plain English, and StatPecker's AI will find the answer from validated sources and present it as a ready-to-use visual. There's no need to learn complex query languages or data tools. Want to know the global smartphone market share or the GDP growth of a country? Just ask, and get a clean chart or infographic instantly, perfect for dropping into your content.
Upload & Analyze CSVs
With the Local SQL Agent feature, you can upload your private CSV files (up to 50MB) and explore them with natural language questions. The best part? Your data never leaves your computer. The entire analysis runs locally on your device, ensuring complete privacy. It prepares your data, generates SQL queries behind the scenes, and delivers key insights as beautiful, shareable visuals.
Publish & Embed
Once you've created a visual, you can make it interactive and seamlessly embed it into your website, blog, or article with a simple snippet of code. This feature allows your audience to engage directly with the data, making your content more dynamic and informative. It’s designed for easy integration, so your stunning visuals work anywhere you publish.
Download & Use Anywhere
Need your infographic for a presentation, report, or social media? StatPecker lets you export your creations as high-quality image files. This gives you the flexibility to use your data visuals across any platform or medium—PowerPoint decks, PDF reports, print materials, or team newsletters—ensuring your insights look professional everywhere.
Use Cases
Opal44
For Small Business Owners
Small business owners wear many hats and rarely have time to decipher analytics. Opal44 helps them understand which marketing efforts are actually bringing in customers, which pages are most popular, and where visitors might be leaving their site. This allows them to make informed decisions about where to spend their limited time and budget, like focusing on a social platform that's driving real sales.
For Marketing Teams
Marketing teams can use Opal44 to streamline reporting and strategy meetings. Instead of preparing complex data slides, they can share clear, conversational insights about campaign performance, content engagement, and audience demographics. This clarity helps align the entire team, justify marketing spend with concrete data, and quickly pivot strategies based on what the AI reveals is working or not.
For Digital Agencies
Agencies can leverage Opal44 to provide exceptional value to their clients. They can generate easy-to-understand reports that clients will actually read and appreciate, demonstrating clear ROI. The plain English explanations and smart tips also empower agencies to offer strategic advice without needing a dedicated data analyst, improving client satisfaction and retention.
For Content Creators & Bloggers
Content creators can use Opal44 to understand what resonates with their audience. They can ask questions like, "Which of my blog posts performed best last month?" and get a simple breakdown of traffic sources, read time, and engagement. The AI's tips can guide them on what topics to write about next or how to optimize existing content for better reach and impact.
StatPecker
For Content Creators & Bloggers
Writers and bloggers can use StatPecker to quickly find and visualize supporting data for their articles. Instead of describing statistics with text, they can embed interactive charts that illustrate their points, making posts more authoritative and engaging for readers, which helps boost time-on-page and shareability.
For Business Analysts & Marketers
Analysts and marketing teams can use the CSV upload feature to analyze sales data, campaign performance, or customer surveys privately. They can generate instant visuals for weekly reports or presentations, identifying trends like top-performing regions or product categories without manual chart building, speeding up decision-making.
For Educators & Researchers
Teachers and academics can simplify complex datasets or historical trends for students by converting them into easy-to-understand infographics. Researchers can also use it to visualize their findings for papers or lectures, making abstract data concrete and memorable for their audience.
For Journalists & Reporters
Journalists on tight deadlines can use the "Ask Your Query" feature to rapidly gather and visualize current statistics for their stories, from election polls to economic indicators. This allows them to create credible, data-rich narratives that enhance their reporting with clear, publish-ready graphics.
Pricing Comparison
Opal44
Opal44 offers simple, tiered pricing to suit different needs. All new users start with a 7-day free trial that includes 50 free actions.
Starter Plan - $47/month
Perfect for small websites and personal projects. Includes 5,000 AI credits per month, insights for one analytics account, basic recommendations, a mobile-friendly dashboard, and email support.
Professional Plan - $97/month (Most Popular)
Ideal for growing businesses and marketing teams. Includes 10,000 AI credits per month, unlimited GA4 account connections, real-time alerts, advanced conversion help, custom reports, priority support, and team collaboration tools.
Agency Plan - $197/month
Built for large organizations with complex needs. Includes unlimited AI credits, custom AI model training, white-label reports (coming soon), advanced reporting, a dedicated account manager, and custom one-on-one support. This plan is available by discussion only.
All plans feature no setup fees, the ability to cancel anytime, and access to customer support.
StatPecker
StatPecker offers straightforward pricing to suit different needs. The Free Tier ($0) is perfect for getting started, offering unlimited projects, manual embeds, 25 AI queries, and 10 CSV uploads. For users who want full, unrestricted access, the Lifetime Access plan is a one-time payment of $150 (with a limited-time 25% discount at checkout). This plan includes lifetime access to all features, unlimited AI queries and CSV uploads, unlimited projects and embeds, priority feature requests, and comes with a 10-day money-back guarantee.
Overview
About Opal44
Opal44 is your friendly, AI-powered guide to understanding your website's performance. It connects directly to your Google Analytics 4 (GA4) account and translates complex data into simple, actionable insights using plain English. If you've ever felt overwhelmed by confusing dashboards, technical jargon, and endless rows of numbers, Opal44 is the solution. It's designed for business owners, marketers, content creators, and agency professionals who need to make data-driven decisions but don't have the time or expertise to become analytics experts. The core value proposition is clarity: you ask simple questions about your traffic, conversions, or user behavior, and Opal44 provides clear answers and smart recommendations. With a focus on security and ease of use, it offers a code-free setup in minutes, real-time alerts for significant changes, and conversational reports that feel like chatting with a knowledgeable colleague. Opal44 empowers you to stop guessing and start understanding exactly what's happening on your site, so you can focus on growing your business.
About StatPecker
StatPecker is your friendly AI-powered sidekick for transforming boring numbers into beautiful, insightful stories. At its heart, it's a smart data visualization tool that takes raw data—whether from online sources or your own CSV files—and turns it into engaging infographics, charts, and reports in seconds. It's built for anyone who needs to communicate data clearly and compellingly, without needing a degree in design or data science. Think of content creators looking to spice up their blog posts, marketers needing to showcase campaign results, educators simplifying complex topics for students, or business analysts who want to share insights quickly with their team. The core value of StatPecker is its simplicity and power: you ask a question or upload your data, and it handles the heavy lifting of analysis and design, saving you hours of manual work in tools like spreadsheets or graphic editors. It’s about making data storytelling accessible, fast, and impactful for everyone.
Frequently Asked Questions
Opal44 FAQ
How does Opal44 connect to my data?
Opal44 connects securely and directly to your Google Analytics 4 (GA4) account using a secure, read-only connection. This means we can view your data to generate insights, but we cannot alter any data within your GA4 property. The setup is code-free and typically takes just a couple of minutes through a simple authentication process with Google.
What are "credits" in your pricing?
Credits are the unit used for AI actions within Opal44. Each time you ask a question, generate a report, or receive an automated insight, it consumes a small number of credits. Our pricing plans include a monthly allowance of credits (e.g., 5,000 in the Starter plan). This system ensures you pay for the level of usage that matches your needs.
Is my GA4 data safe with Opal44?
Absolutely. Your data security and privacy are our top priorities. We use a secure, read-only connection to your GA4 account. We never sell, share, or use your data for training unrelated AI models. Your information stays yours, and you maintain full control. You can disconnect your GA4 account from Opal44 at any time.
Can I try Opal44 for free?
Yes! We offer a 7-day free trial that includes 50 AI credits to explore the platform. This allows you to connect your GA4 account, ask questions, and see the plain-English insights for yourself. No credit card is required to start the trial, so you can test it risk-free and decide if it's the right tool for you.
StatPecker FAQ
Is my data safe when I upload a CSV file?
Absolutely. When you use the Local SQL Agent feature, your data privacy is the top priority. Your CSV file is processed entirely on your own device. Nothing is sent to StatPecker's servers, meaning your sensitive business or personal data stays completely private and secure on your computer during analysis.
What kind of questions can I ask the AI?
You can ask a wide range of data-driven questions! The AI pulls from validated public sources to answer queries about business, economics, demographics, technology trends, and more. Examples include "What is the renewable energy capacity in Europe?" or "Show me the top 5 countries by internet penetration." Think of it as a research assistant for facts and figures.
Do I need to know how to code or use SQL?
Not at all. StatPecker is designed for ease of use. You interact with it using simple, natural language. Whether you're asking a question or exploring your CSV file, you just type what you want to know (e.g., "Which product had the highest sales last quarter?"), and the tool handles all the complex query generation and coding in the background for you.
Can I try StatPecker for free?
Yes! StatPecker offers a generous Free Tier that allows you to explore its core capabilities at no cost. This includes creating unlimited projects, making a number of AI queries, and uploading several CSV files. It's a great way to see how the tool can fit into your workflow before considering any paid plan.
Alternatives
Opal44 Alternatives
Opal44 is a business intelligence tool that uses AI to simplify your Google Analytics 4 data. It translates complex website metrics into clear, actionable insights you can get just by asking questions in plain English, removing the usual jargon and steep learning curve. People often explore alternatives to tools like Opal44 for various reasons. You might be looking for a different price point, need specific integrations with other platforms in your tech stack, or require more advanced, hands-on reporting features beyond conversational AI. It's a normal part of finding the perfect fit for your business needs and budget. When evaluating other options, consider what matters most to you. Key factors include the overall cost and pricing model, the specific features and depth of analysis offered, how easily it connects to your existing tools, and the quality of the support and user experience. Focusing on these areas will help you find a solution that truly works for your workflow.
StatPecker Alternatives
StatPecker is a smart, AI-powered tool in the business intelligence and marketing space that helps you quickly turn data into beautiful, engaging infographics. It’s designed for anyone who needs to tell a clearer story with their numbers, from marketers to educators. People often explore other options for a variety of reasons. Maybe they need a different pricing model, require a specific feature StatPecker doesn’t offer, or must integrate with a particular set of tools they already use. It’s a normal part of finding the perfect fit for your unique workflow and budget. When evaluating other tools, consider what matters most to you. Think about the types of data visualizations you need, how easy the tool is to use, where you need to publish your final graphics, and of course, your budget. The goal is to find a solution that makes your data work for you, not the other way around.