MadeWithStack vs StatPecker
Side-by-side comparison to help you choose the right AI tool.
MadeWithStack
MadeWithStack is an agent-native directory that showcases real products built by founders and AI agents, along with the technology stacks used to crea

StatPecker gives you fast, private AI insights and stunning visuals from your data.
Last updated: March 1, 2026
Visual Comparison
MadeWithStack
StatPecker
Overview
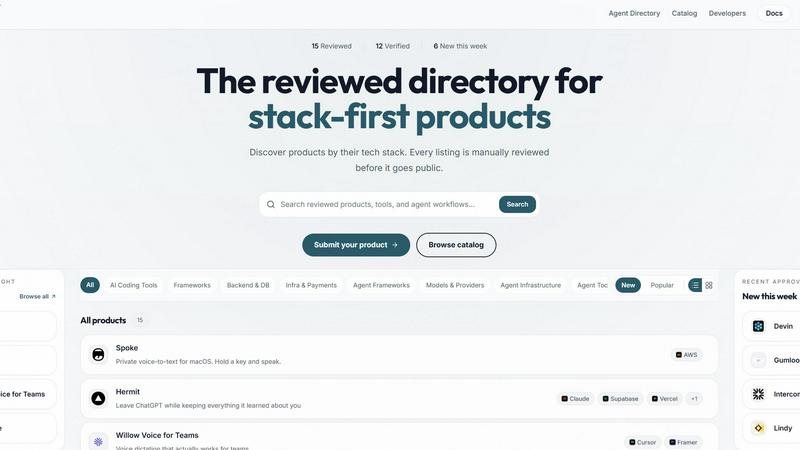
About MadeWithStack
MadeWithStack is a curated agent-native product directory that showcases real applications built by indie founders, developers, and AI agents. Each listing highlights the tools, frameworks, and technologies used to build the product, giving builders transparency into modern development stacks.
The platform allows founders and agents to submit products while ensuring listings are reviewed for authenticity and stack verification. By combining product discovery with stack insights, MadeWithStack helps developers learn how real products are built and discover new tools powering today’s startups.
It aims to become a trusted catalog of agent-built and founder-built products, providing a transparent look into the technologies behind modern apps.
About StatPecker
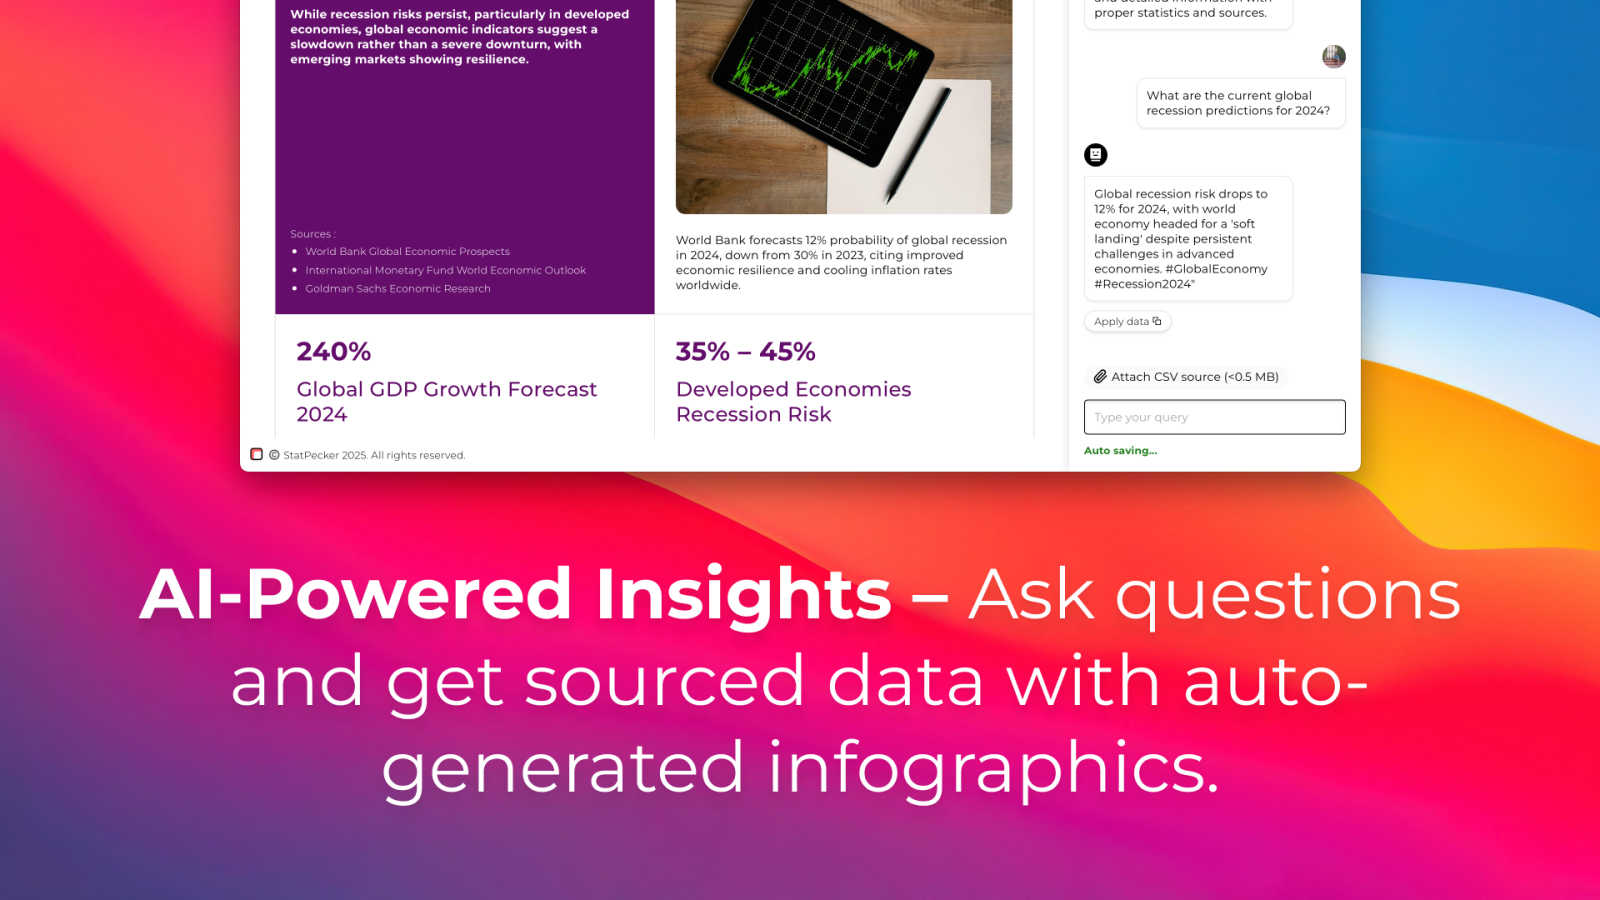
StatPecker is your friendly AI-powered sidekick for transforming boring numbers into beautiful, insightful stories. At its heart, it's a smart data visualization tool that takes raw data—whether from online sources or your own CSV files—and turns it into engaging infographics, charts, and reports in seconds. It's built for anyone who needs to communicate data clearly and compellingly, without needing a degree in design or data science. Think of content creators looking to spice up their blog posts, marketers needing to showcase campaign results, educators simplifying complex topics for students, or business analysts who want to share insights quickly with their team. The core value of StatPecker is its simplicity and power: you ask a question or upload your data, and it handles the heavy lifting of analysis and design, saving you hours of manual work in tools like spreadsheets or graphic editors. It’s about making data storytelling accessible, fast, and impactful for everyone.