LoadTester
LoadTester helps engineering teams run distributed HTTP and API load tests from their browser or CI/CD pipeline without managing any infrastructure.
About LoadTester
LoadTester is a modern, cloud-native HTTP and API load testing tool designed for engineering teams who need fast, repeatable performance checks without the overhead of managing infrastructure. Built by Cloud Native d.o.o., LoadTester allows you to create, launch, and monitor load tests directly from your browser or integrate them seamlessly into your CI/CD pipeline. The core value proposition is simplicity: you can go from zero to a running test with thousands of virtual users in under three seconds. No servers to provision, no worker pools to configure, and no complex setup scripts. The tool is built for scale, supporting up to 10,000 virtual users and 10,000 requests per second on its free plan, with live analytics that show throughput, latency (p50, p95, p99), and error rates in real time. It is designed for developers, QA engineers, and SREs who want to catch performance regressions before they impact end users. LoadTester provides features like smart auto-stop thresholds, scheduled baseline tests, run-to-run comparisons, and integrations with Slack, email, and webhooks. Whether you are testing a critical checkout endpoint, validating a new microservice, or running nightly release gates, LoadTester gives you the data you need to ship with confidence. The tool includes exports to PDF, CSV, and JSON, making it easy to share results with your team or stakeholders. With a free plan available and no infrastructure to manage, LoadTester removes the traditional barriers to entry for performance testing.
Features of LoadTester
Instant Execution and Distributed Workers
Start distributed load tests in seconds without any infrastructure setup. LoadTester handles worker scaling, orchestration, and execution flow automatically. You simply define your test scenario, choose between virtual users or requests per second mode, and hit run. The system boots in under three seconds and dispatches workers immediately, with zero queue time. This means your team focuses on analyzing results, not managing infrastructure.
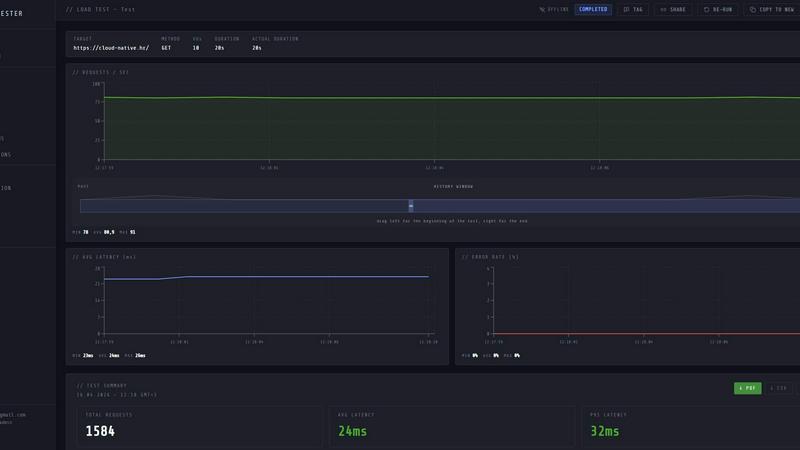
Live Analytics and Real-Time Telemetry
Watch requests, latency, failures, throughput, and bottlenecks in real time while your test is running. The live dashboard updates continuously with key metrics like RPS, p50, p95, and p99 latency, active virtual users, and error counts. You can see latency distribution charts over the last 60 seconds, making it easy to spot performance degradation as it happens. This immediate feedback loop is critical for debugging and validating changes quickly.
Smart Auto-Stop with Thresholds
Set failure or latency thresholds and automatically stop tests when things go sideways. You can define guards for p95 latency, error rate, and regression compared to a baseline. For example, you can configure a test to auto-stop if p95 latency exceeds 400 milliseconds or if the error rate goes above 2 percent. You can also set regression alerts that notify Slack and email if performance degrades by a certain percentage compared to a previous run.
CI/CD Integration and Automated Workflows
Run tests on every deploy with seamless CI/CD integration. LoadTester supports webhooks, Slack alerts, and email notifications, allowing you to automate performance checks as part of your release pipeline. You can schedule tests to run daily or at specific times, such as nightly release gates. The tool also provides API access for programmatic control, making it easy to integrate into your existing workflow and catch regressions before code reaches production.
Use Cases of LoadTester
Pre-Deployment Performance Validation
Before shipping a new feature or a critical update, run a quick load test to ensure the endpoint can handle expected traffic. For example, test a checkout spike scenario with 500 requests per second for five minutes. If p95 latency stays under 400 milliseconds and error rates remain below 2 percent, you can deploy with confidence. This use case prevents performance regressions from reaching production and impacting real users.
Nightly Release Gates and Scheduled Baselines
Set up automated, scheduled load tests that run every night at a specific time, such as 02:00 UTC. These tests act as release gates, providing a consistent performance baseline that you can compare against each day. If a nightly test shows a significant regression in latency or an increase in errors, your team gets alerted immediately via Slack or email. This proactive approach helps catch issues introduced by code changes or infrastructure updates.
Capacity Planning and Scaling Validation
Use LoadTester to simulate peak traffic scenarios and validate your application's capacity. For instance, run a test with 10,000 virtual users hitting your API to see how the system behaves under maximum load. Analyze the live charts to identify bottlenecks, such as high p99 latency or increasing error rates. This data helps you make informed decisions about scaling resources, optimizing code, or adding caching layers.
CI/CD Pipeline Integration for Continuous Testing
Integrate LoadTester directly into your continuous integration and continuous deployment pipeline. On every pull request or merge to the main branch, automatically trigger a load test against the staging environment. Use the API to start a test, wait for completion, and check if the results pass predefined thresholds. If the test fails, the pipeline can be blocked, preventing performance regressions from being merged. This use case ensures performance is a first-class citizen in your development workflow.
Frequently Asked Questions
How do I get started with LoadTester?
Getting started is simple. Visit the LoadTester website and sign up for a free account. Once logged in, you can create your first test by specifying the HTTP method, target URL, and choosing between virtual users or requests per second mode. Set the rate and duration, then click run. Your test will start in under three seconds, and you will see live analytics immediately. No infrastructure setup or configuration is required.
What kind of metrics does LoadTester provide during a live run?
During a live run, LoadTester provides real-time metrics including requests per second (RPS), p50, p95, and p99 latency, active virtual users, total requests, error count, and success rate. You also get a latency distribution chart showing the last 60 seconds of data. After the test completes, you receive a clear summary with total requests, average latency, p95, data sent, and data received.
Can I integrate LoadTester with my existing CI/CD pipeline?
Yes, LoadTester is designed for CI/CD integration. It provides API access for programmatic control, webhooks for triggering actions on test completion, and supports Slack and email alerts. You can schedule tests to run automatically at specific times or trigger them as part of your deployment pipeline. This allows you to catch performance regressions before code reaches production.
What are the pricing options and limits for LoadTester?
LoadTester offers a free plan that supports up to 10,000 virtual users and 10,000 requests per second. The free plan allows you to run tests and access core features. For higher limits, advanced integrations, and team features, you can view the detailed pricing page on the LoadTester website. There is no infrastructure to manage, so you only pay for the testing capabilities you need.
Similar to LoadTester
JustLaunched
The launch platform for indie makers — schedule your launch, get in front of buyers, and blast across directories.
MCP Playground Online
Browser-based platform for building, testing, and deploying MCP AI agents. No SDKs, no setup just connect, debug, deploy, and scale.
AICode
AI coding assistant specifically designed to maintain complex legacy enterprise software.
CyberGapAudit
Score your security posture against NIST CSF 2.0 and get a prioritized remediation roadmap.